Land Sensing Geospatial Analytics
From Satellite to Decision
Satellite observation, machine learning and field verification, combined into evidence you can act on.
The four stages at a glance
Four stages, every project
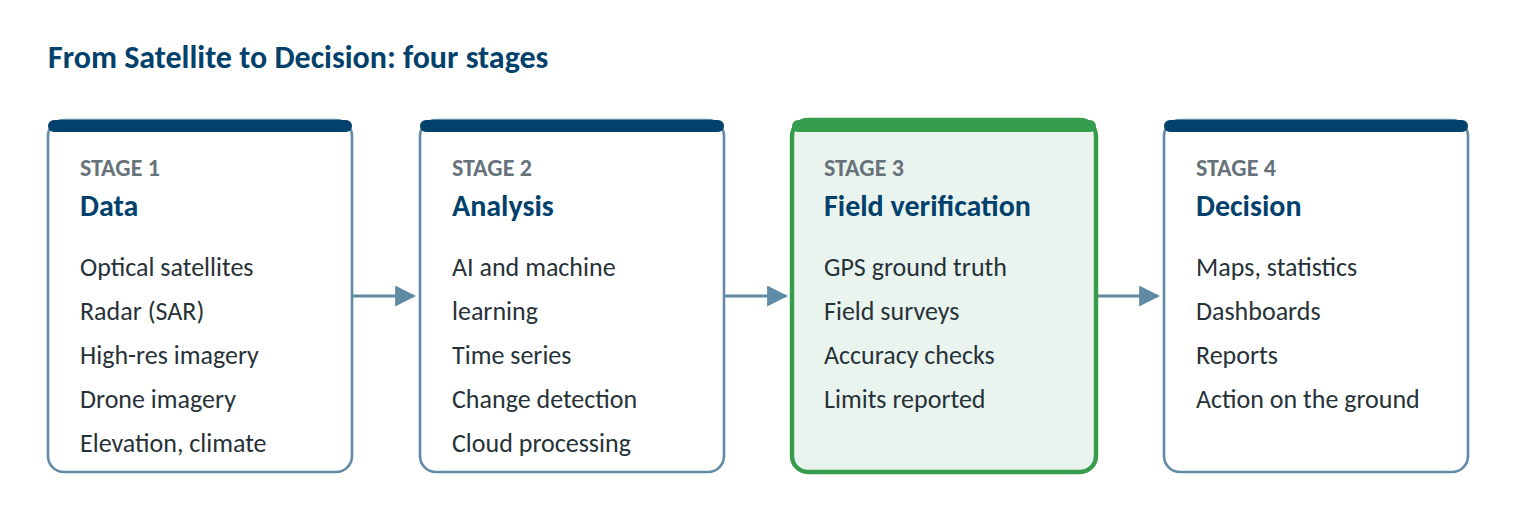
Every LSGA project follows the same four stages. We start from the data, analyse it, check the results in the field, and deliver information you can use for your decisions.
1 · Data — what we observe
We choose the data for each project by the question it has to answer, the size of the area and the budget.
Satellite imagery
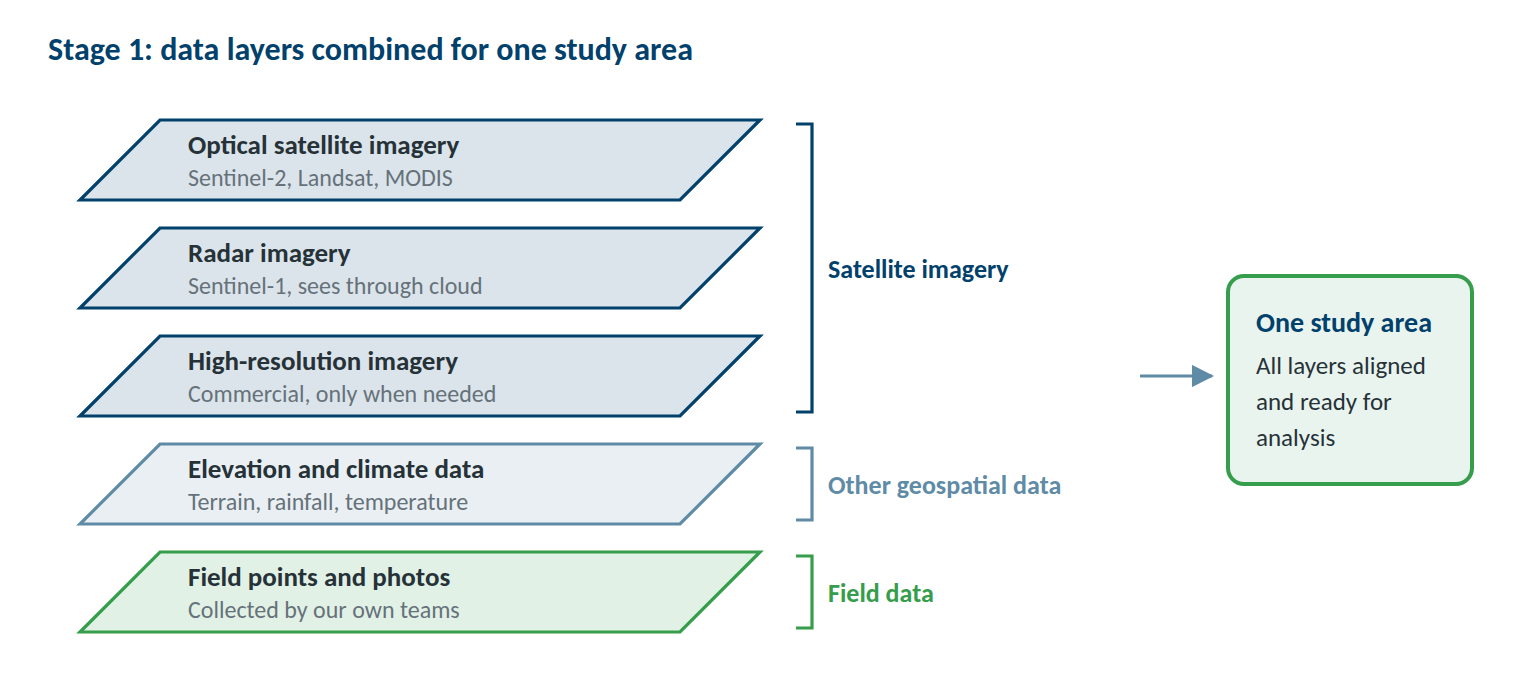
Free optical and radar imagery from Sentinel-2, Landsat, MODIS and Sentinel-1 is our starting point. It covers large areas, repeats every few days and goes back decades. Radar sees through cloud, which matters for floods and cloudy seasons. When a project needs finer detail, such as single buildings or small fields, we add commercial imagery at up to 30 cm resolution.
Other geospatial data and field data
Elevation models, rainfall and temperature records, and existing maps complete the picture. Drone imagery adds site-level detail through partners. Our own field teams add GPS points, photos and short observations from the ground.
2 · Analysis — how we process it
We turn images into maps, numbers and trends.
Machine learning classification
Models such as Random Forest learn from our field reference points and then recognise land cover, crop types and other classes across the whole area. Where crops change during the year, we build a separate model for each season.
Indices, time series and change detection
Vegetation, snow, temperature and drought indices (NDVI, VHI, NDSI, land surface temperature and SPI), followed over months and years, show when and where conditions change and how today compares with the past.
All processing runs in the cloud on Google Earth Engine, with documented workflows that can be run again each season or for a new area.
3 · Field verification — how we check it
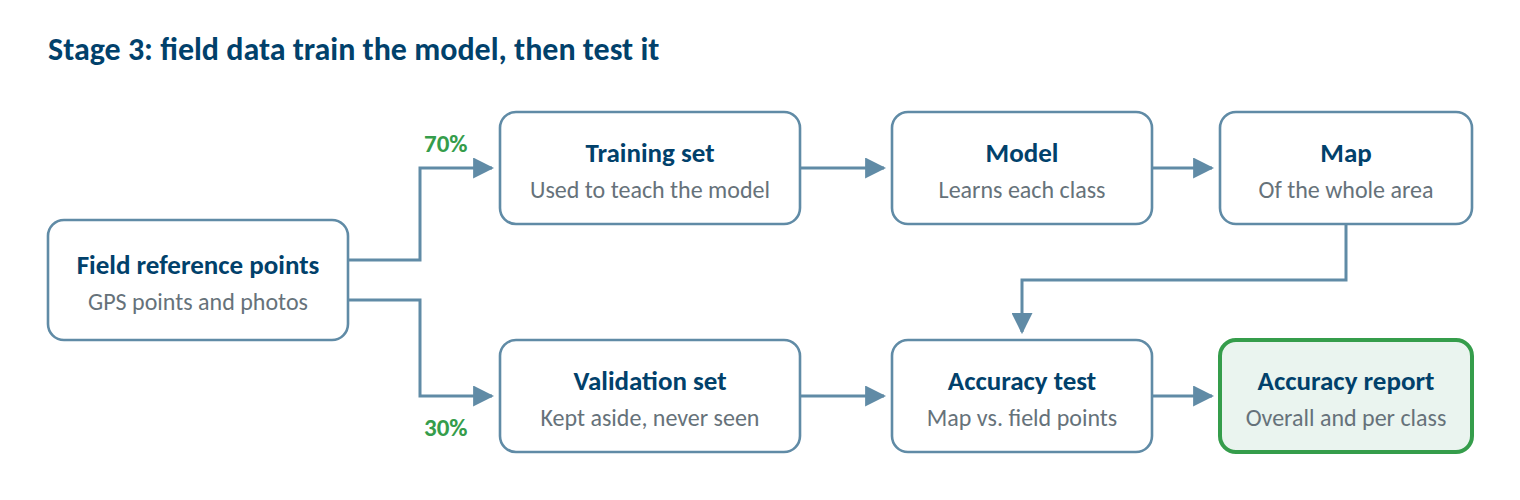
Field data do two jobs: they teach the model, and they test it.
Collecting reference points
Before fieldwork, we plan where to collect points so that every class and every part of the area is covered. Our teams then record GPS points, photos and short observations with mobile data collection apps. Our land cover mapping of northern Afghanistan used 23,216 reference points.
Testing accuracy openly
We keep part of the field data aside, often 30%, and use it only to test the finished map. We report the overall accuracy and the accuracy of each class, and we say where the map is less reliable. Our seasonal crop maps of the Khulm Watershed reached 87% accuracy in spring and 88% in summer.
4 · Decision — what it supports
The last stage turns results into something you can use.
What you receive
Maps, GIS data, area statistics and plain-language reports, with the accuracy of every map stated.
See our services →Decisions it supports
- Targeting programmes and support
- Planning land and water use
- Preparing for drought and hazards
- Verifying project results
Worked example
From satellite to decision: one project
How the four stages worked in our seasonal crop mapping of the Khulm Watershed, Afghanistan.
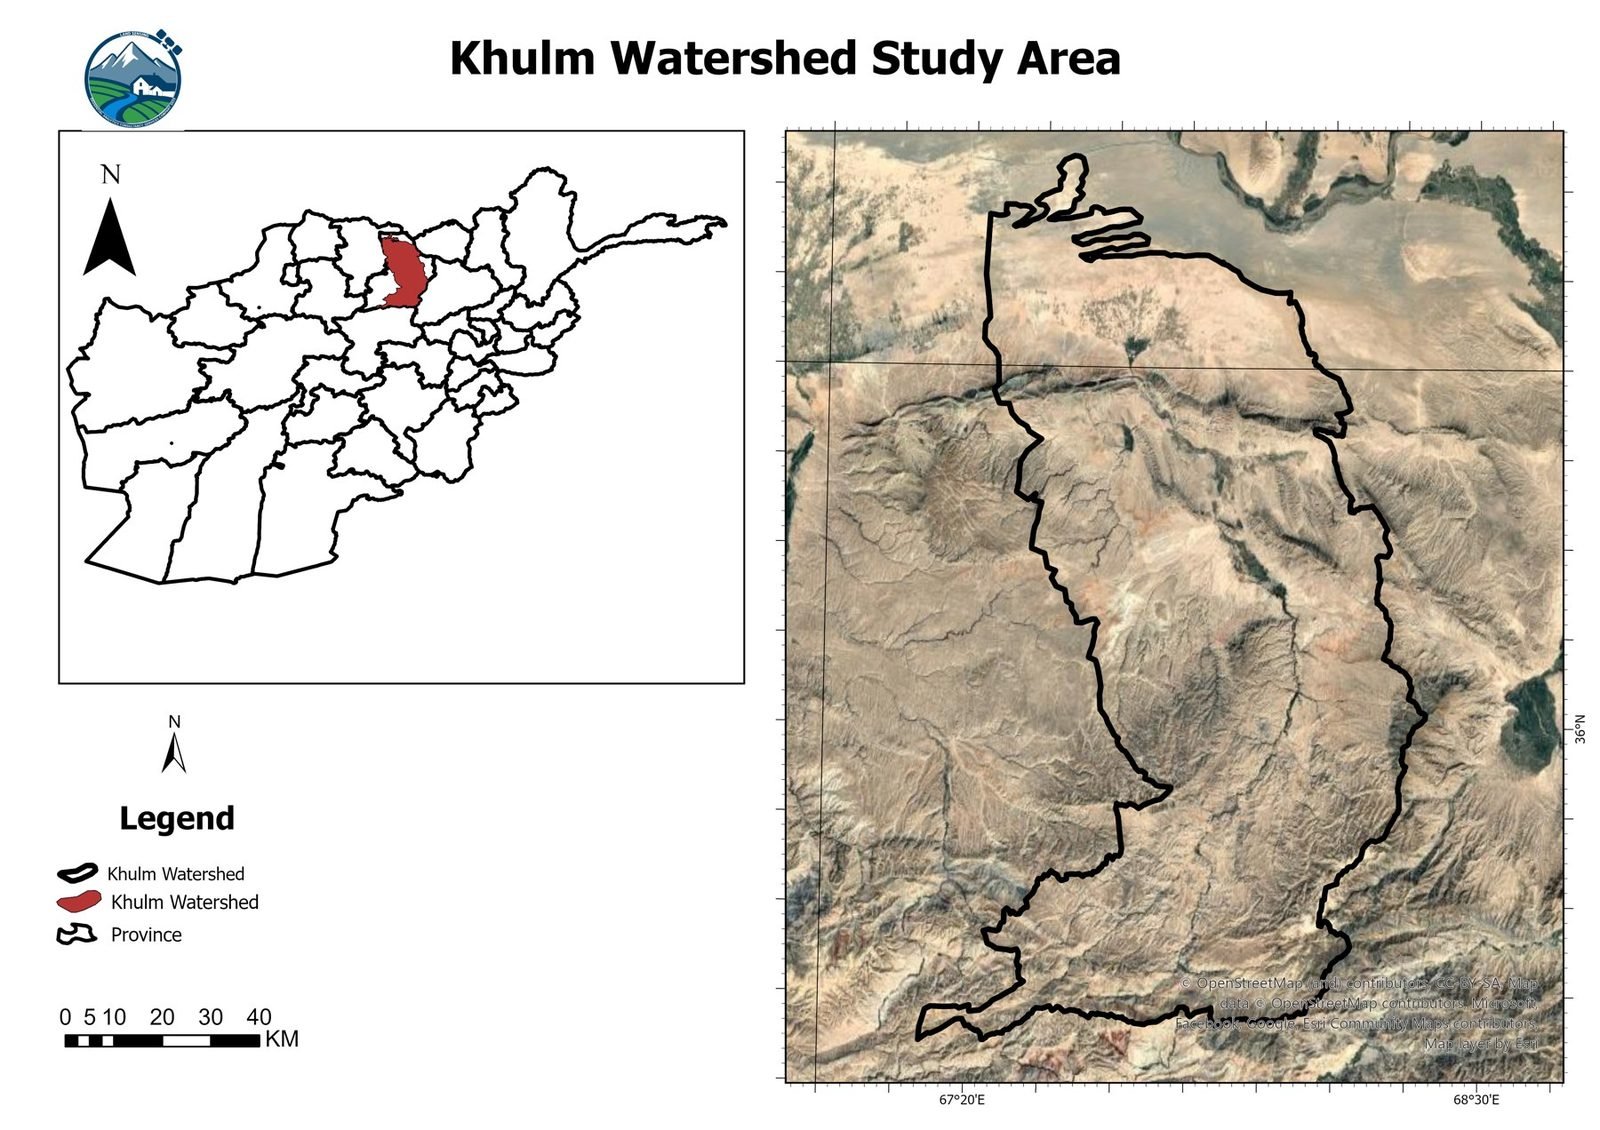
Sentinel-2 & Sentinel-1 Imagery
Sentinel-2 and Sentinel-1 imagery at about 10 m resolution, followed through the spring and summer growing seasons.
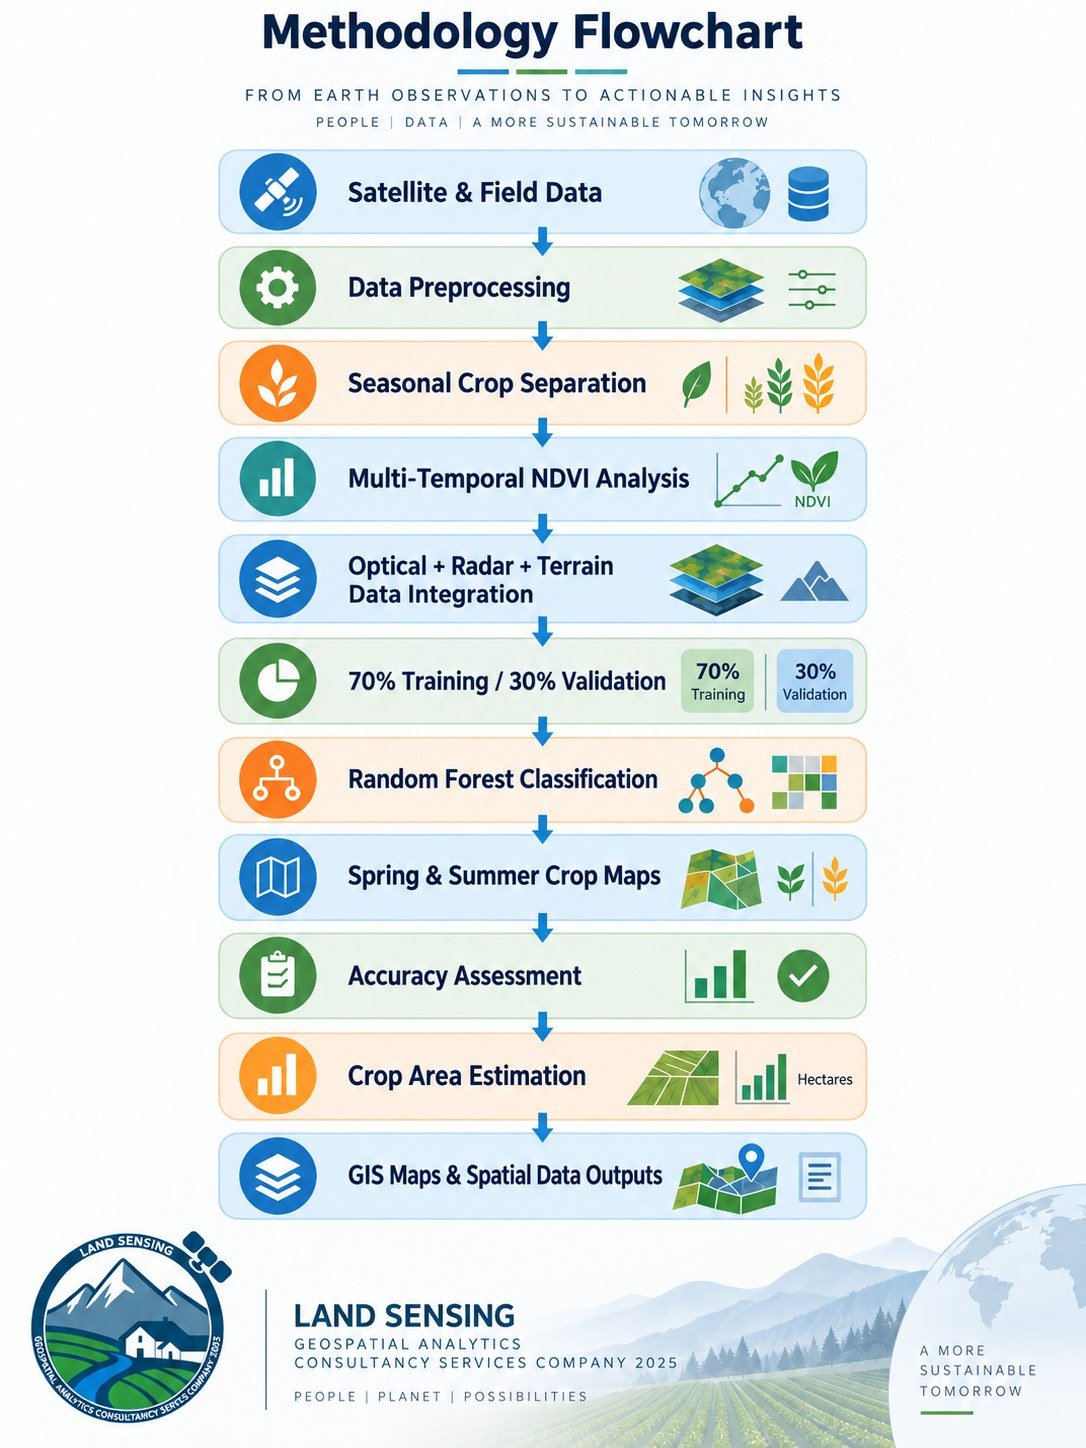
Seasonal Random Forest Models
Two Random Forest models in Google Earth Engine, one for spring crops and one for summer crops.
70% Training / 30% Testing
Field observations of crops, split into 70% for training and 30% for independent testing.
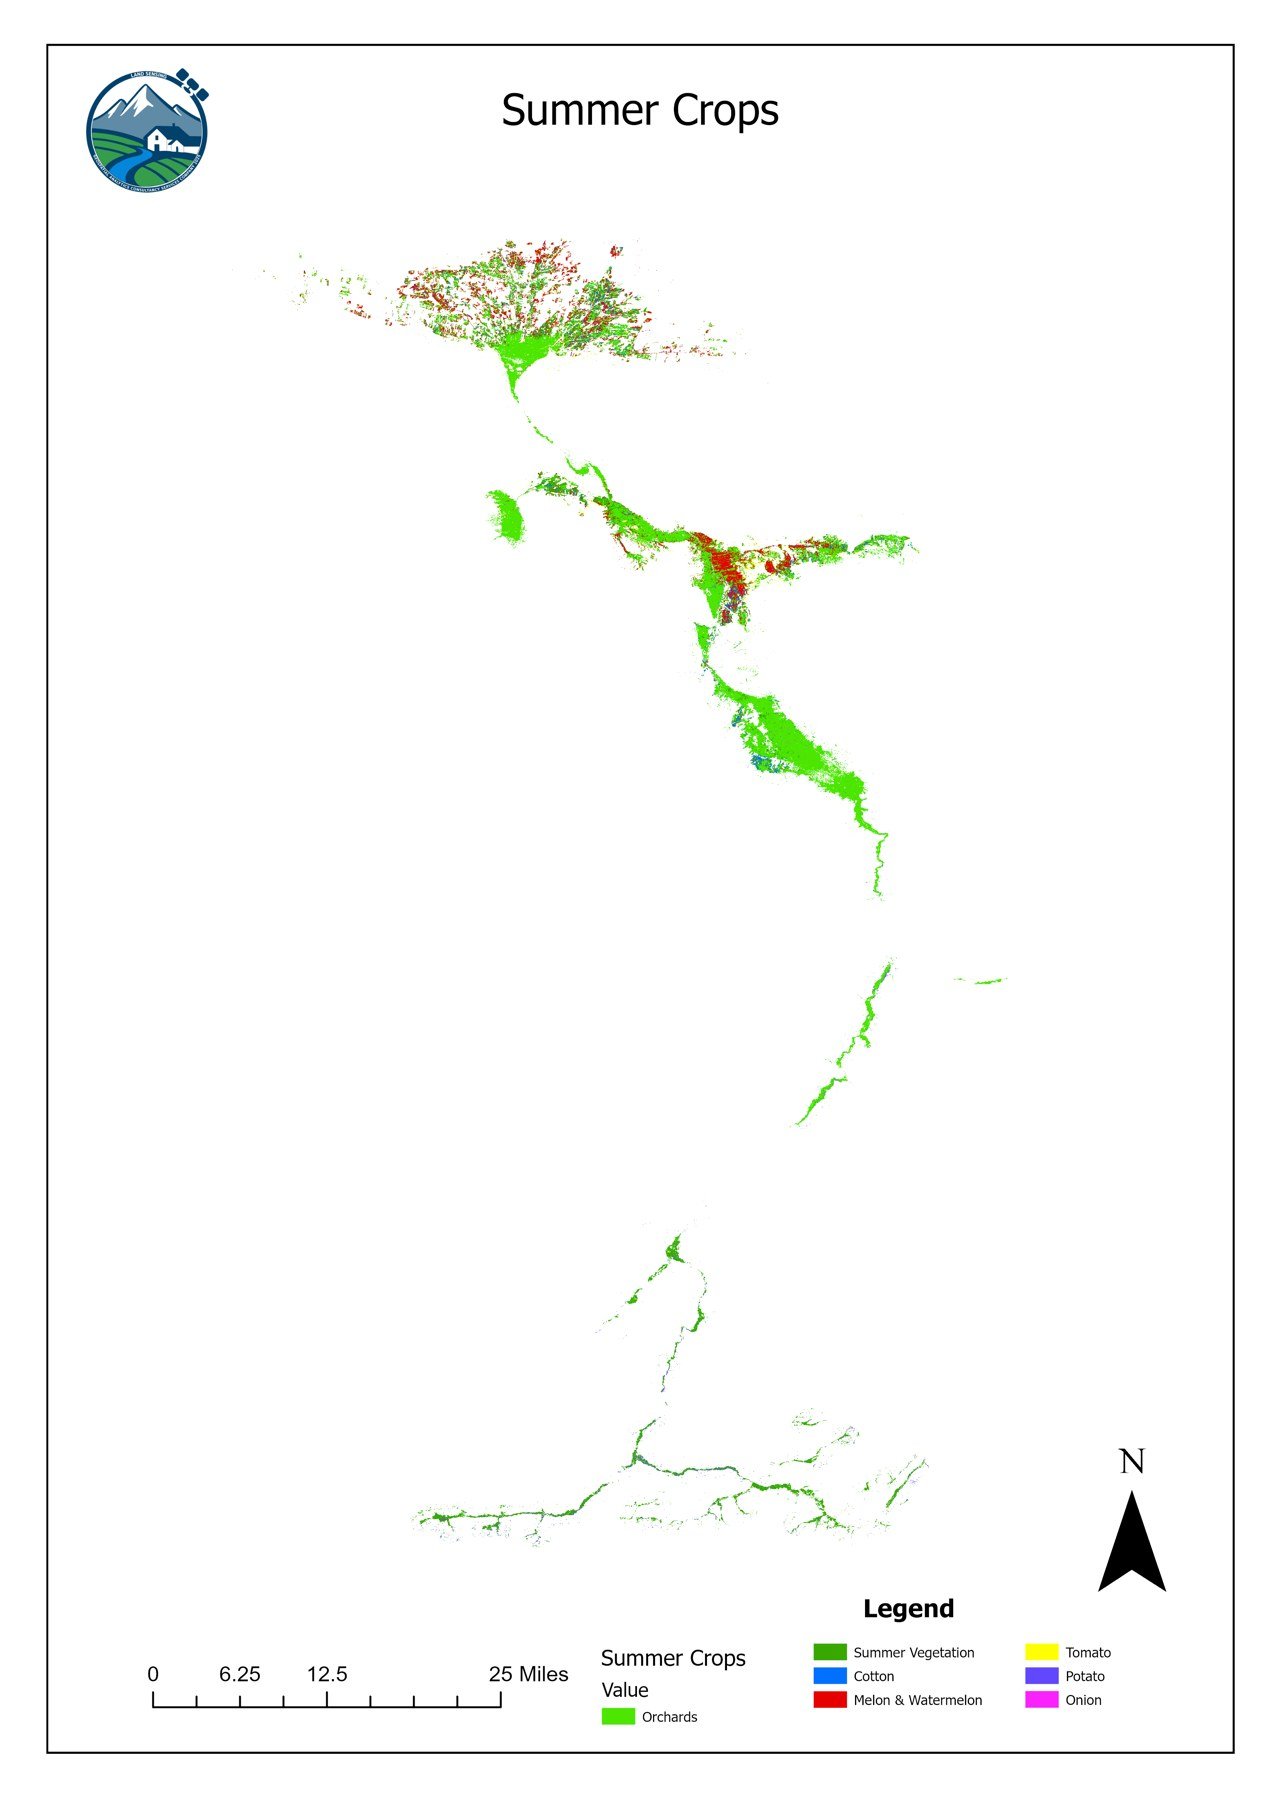
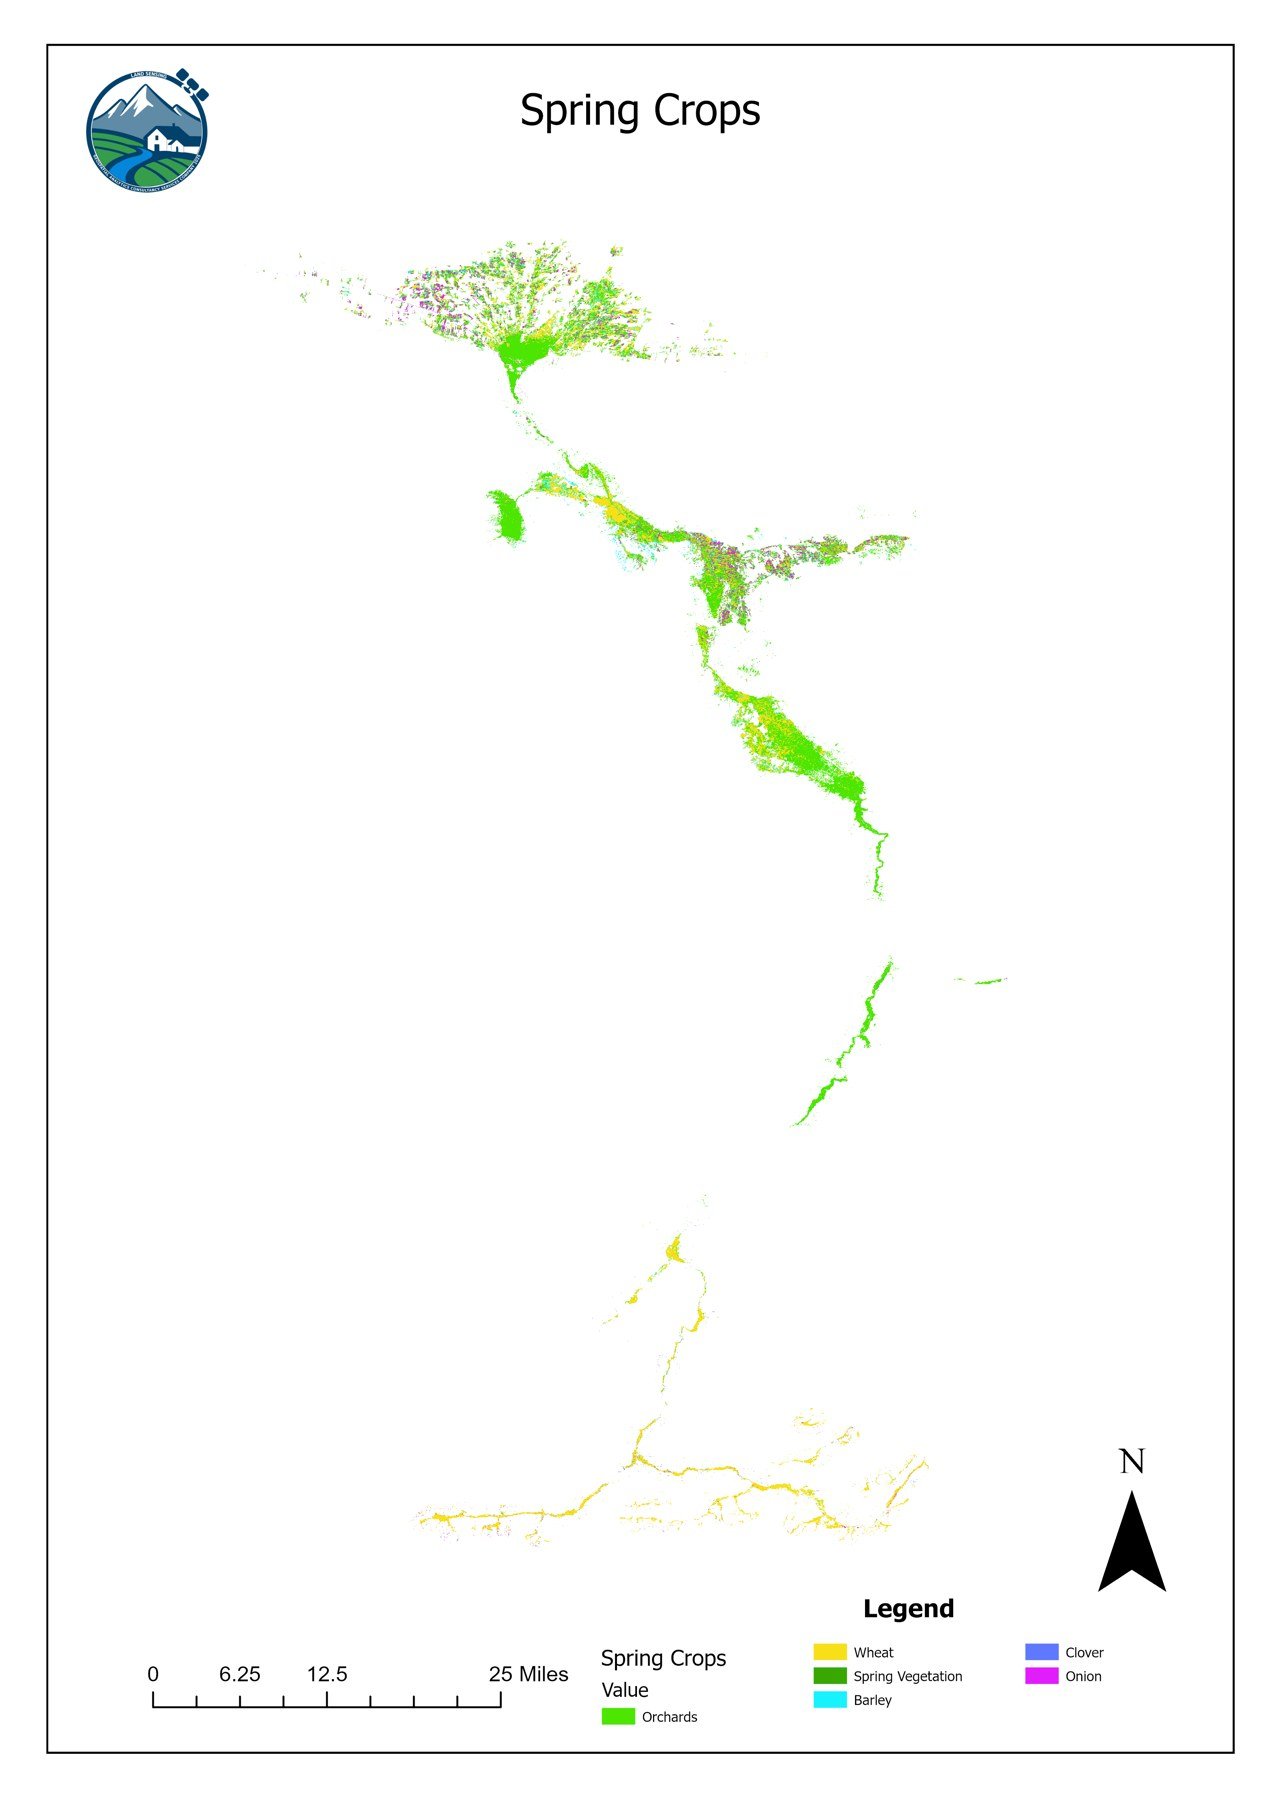
87% & 88% Accuracy Maps
Spring and summer crop maps at 87% and 88% accuracy, with the area of each crop in hectares.
Tools we use