Understanding drought across northern Afghanistan
Drought is one of the most important environmental challenges affecting water availability, ecosystems and agricultural productivity in Afghanistan. This research investigates how drought changed over time and across the Northern River Basin between 2001 and 2020, by combining precipitation, land surface temperature, snow cover and vegetation condition.
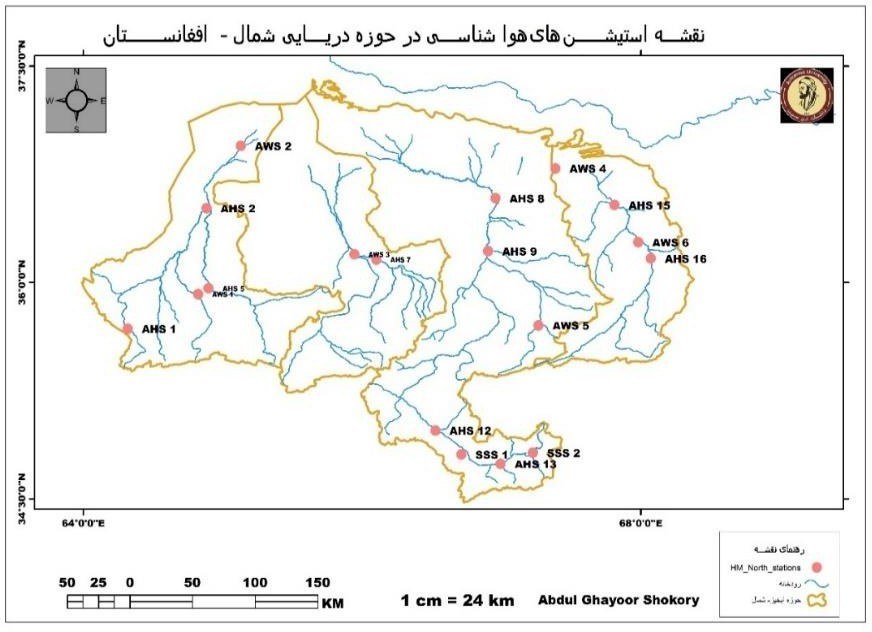
The study area has two distinct climate zones: a colder south and a warmer north. The basin has 24 observation stations, including hydrological, automatic weather and snow survey stations; rainfall was analysed at 18 of these locations.
Challenges, datasets and analytical workflow
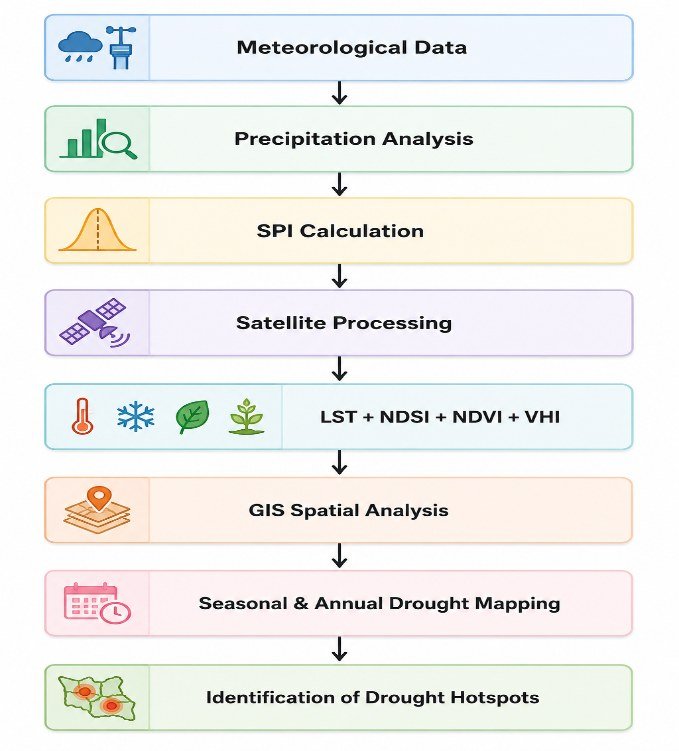
A rainfall deficit alone cannot describe drought impacts; vegetation, surface temperature and snow cover add evidence of stress. Because conditions vary strongly between spring, summer, autumn and winter, the study looks at both seasonal and annual patterns.
| Dataset | Source | Purpose |
|---|---|---|
| Precipitation (SPI) | NASA POWER | Meteorological drought |
| Land surface temperature (LST) | MODIS MOD11A2 | Heat stress |
| NDSI | MODIS | Snow cover monitoring |
| NDVI | MODIS | Vegetation condition |
| VHI | Remote sensing | Vegetation drought and health |
Standardized Precipitation Index (SPI)
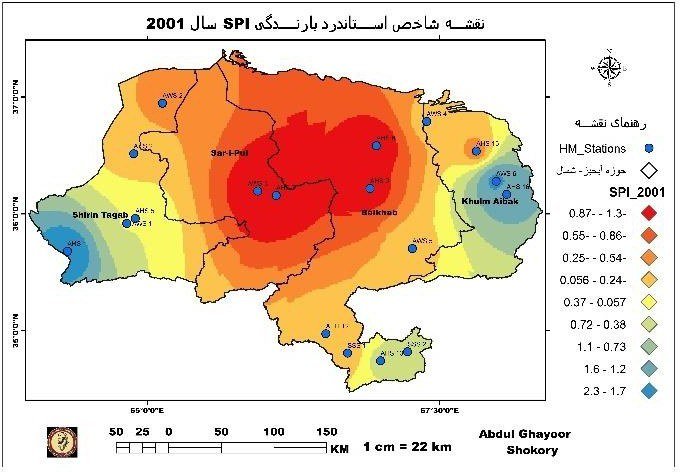
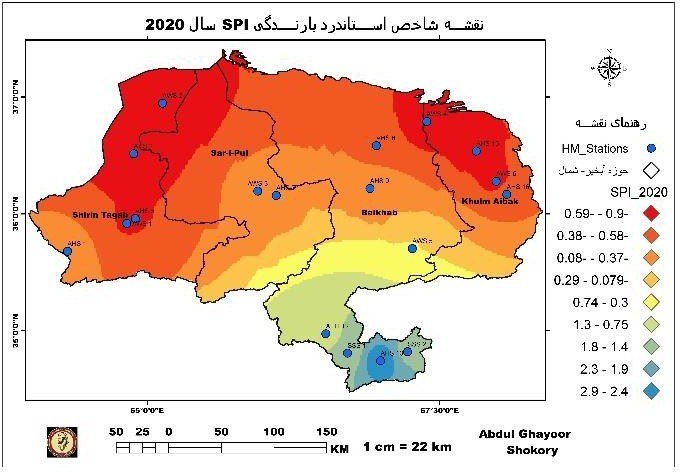
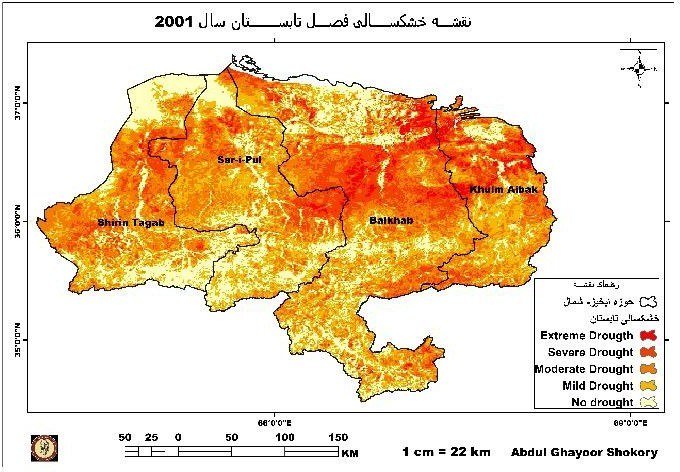
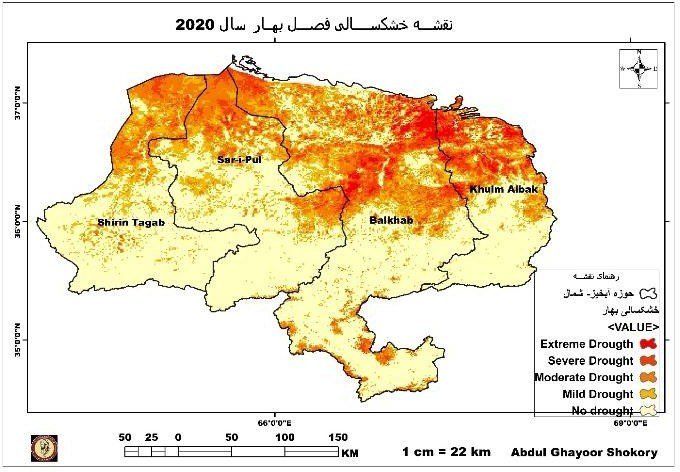
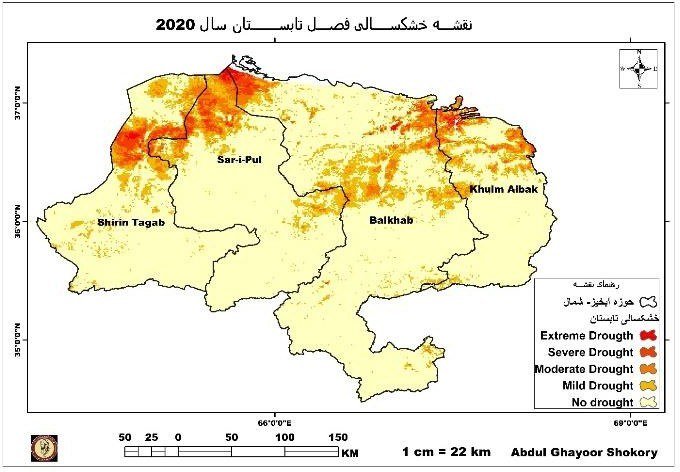
SPI was calculated at different time scales to identify rainfall-based drought. Monthly SPI for the 20 years was calculated in R, and GIS tools were used to map it. The maps show clear differences in drought intensity between the Balkhab, Sar-e-Pul, Khulm–Aibak and Shirin Tagab sub-basins.
What the 20-year analysis revealed
- Severe drought years: The SPI analysis identified 2001, 2002, 2004, 2008, 2011, 2014 and 2018 as key drought years. The most severe values were SPI −2.6 in 2001 and SPI −2.5 in 2018.
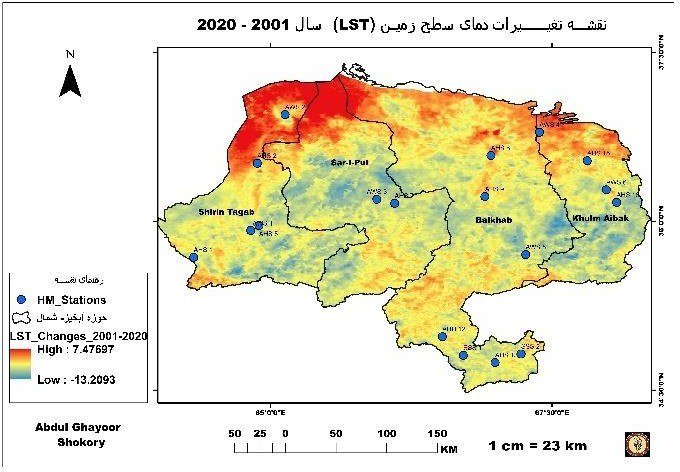
- Temperature stress increased: Land surface temperature reached about 56 °C, particularly in the Shirin Tagab sub-basin, and rose by about 0.43 °C overall between 2001 and 2020.
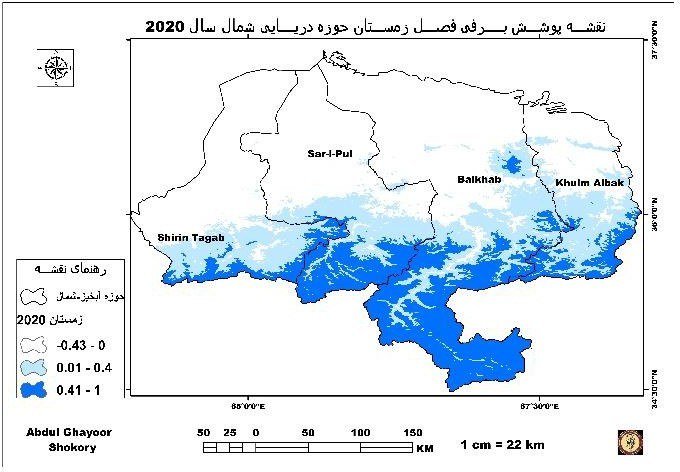
- Snow cover changed over time: The most snow was in the south of the study area, towards Bamyan, Samangan, Sar-e-Pul and Faryab. Snow cover was high in 2007–2008 and lower during drought periods.
Vegetation condition (NDVI) & Seasonal drought maps
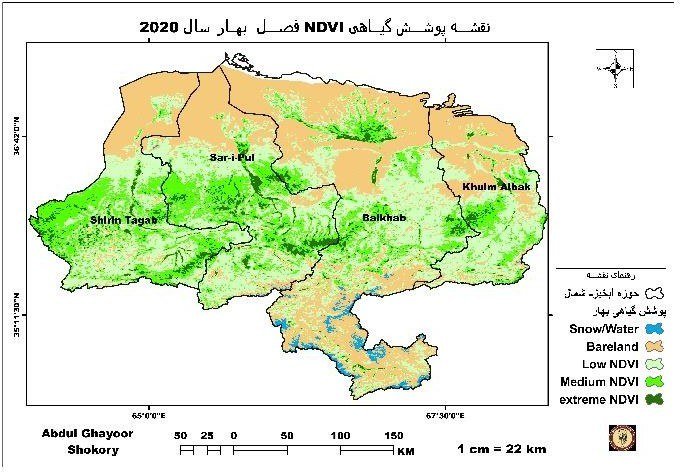
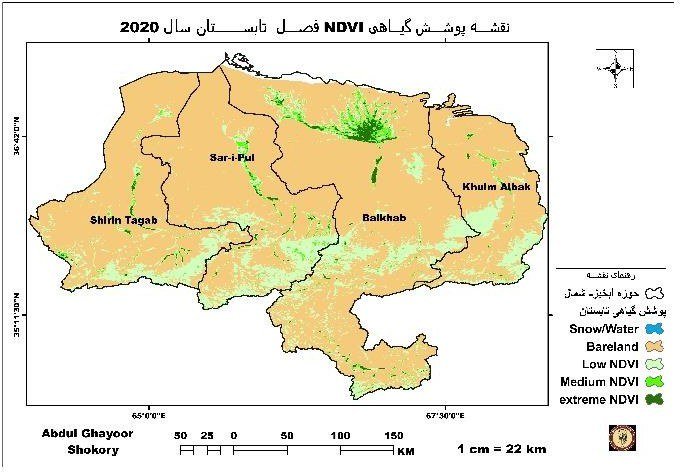
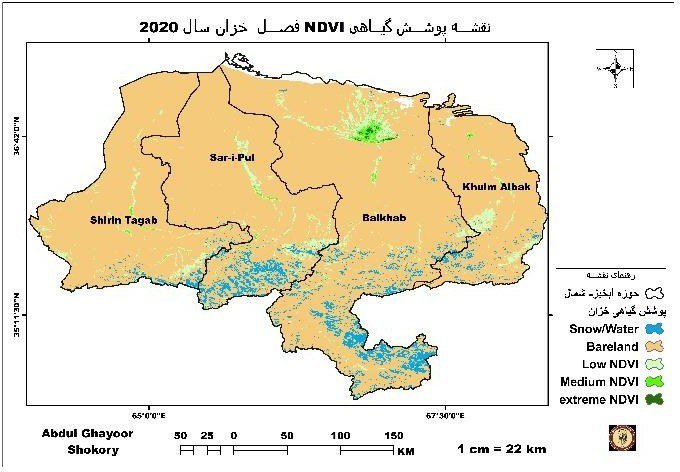
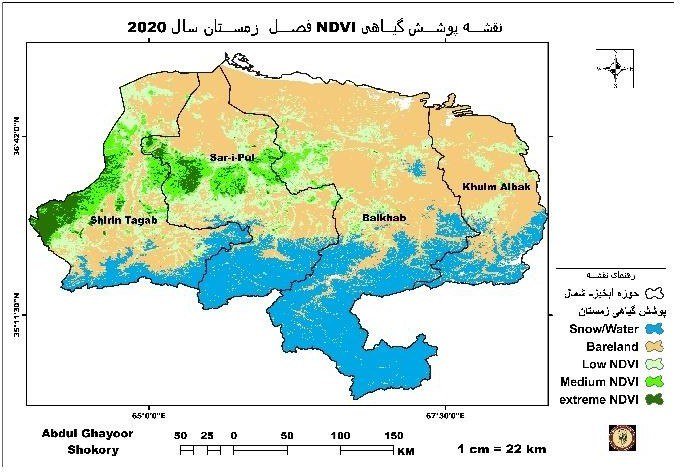
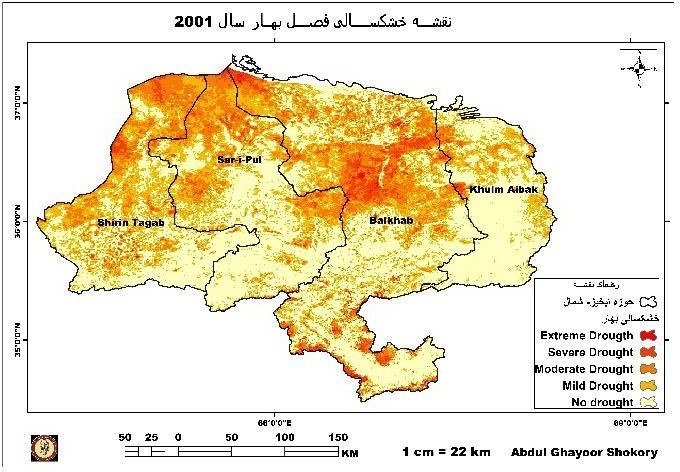
NDVI and VHI gave further evidence of drought stress, with particularly poor vegetation in 2001, 2008, 2011 and 2018. The strongest impacts were in the warmer north of the basin, and summer 2001 showed widespread drought.
Contribution: This study gives a 20-year spatial view of drought in one of Afghanistan’s important river basins, and shows how data from several sources can support drought assessment and resource management decisions.