
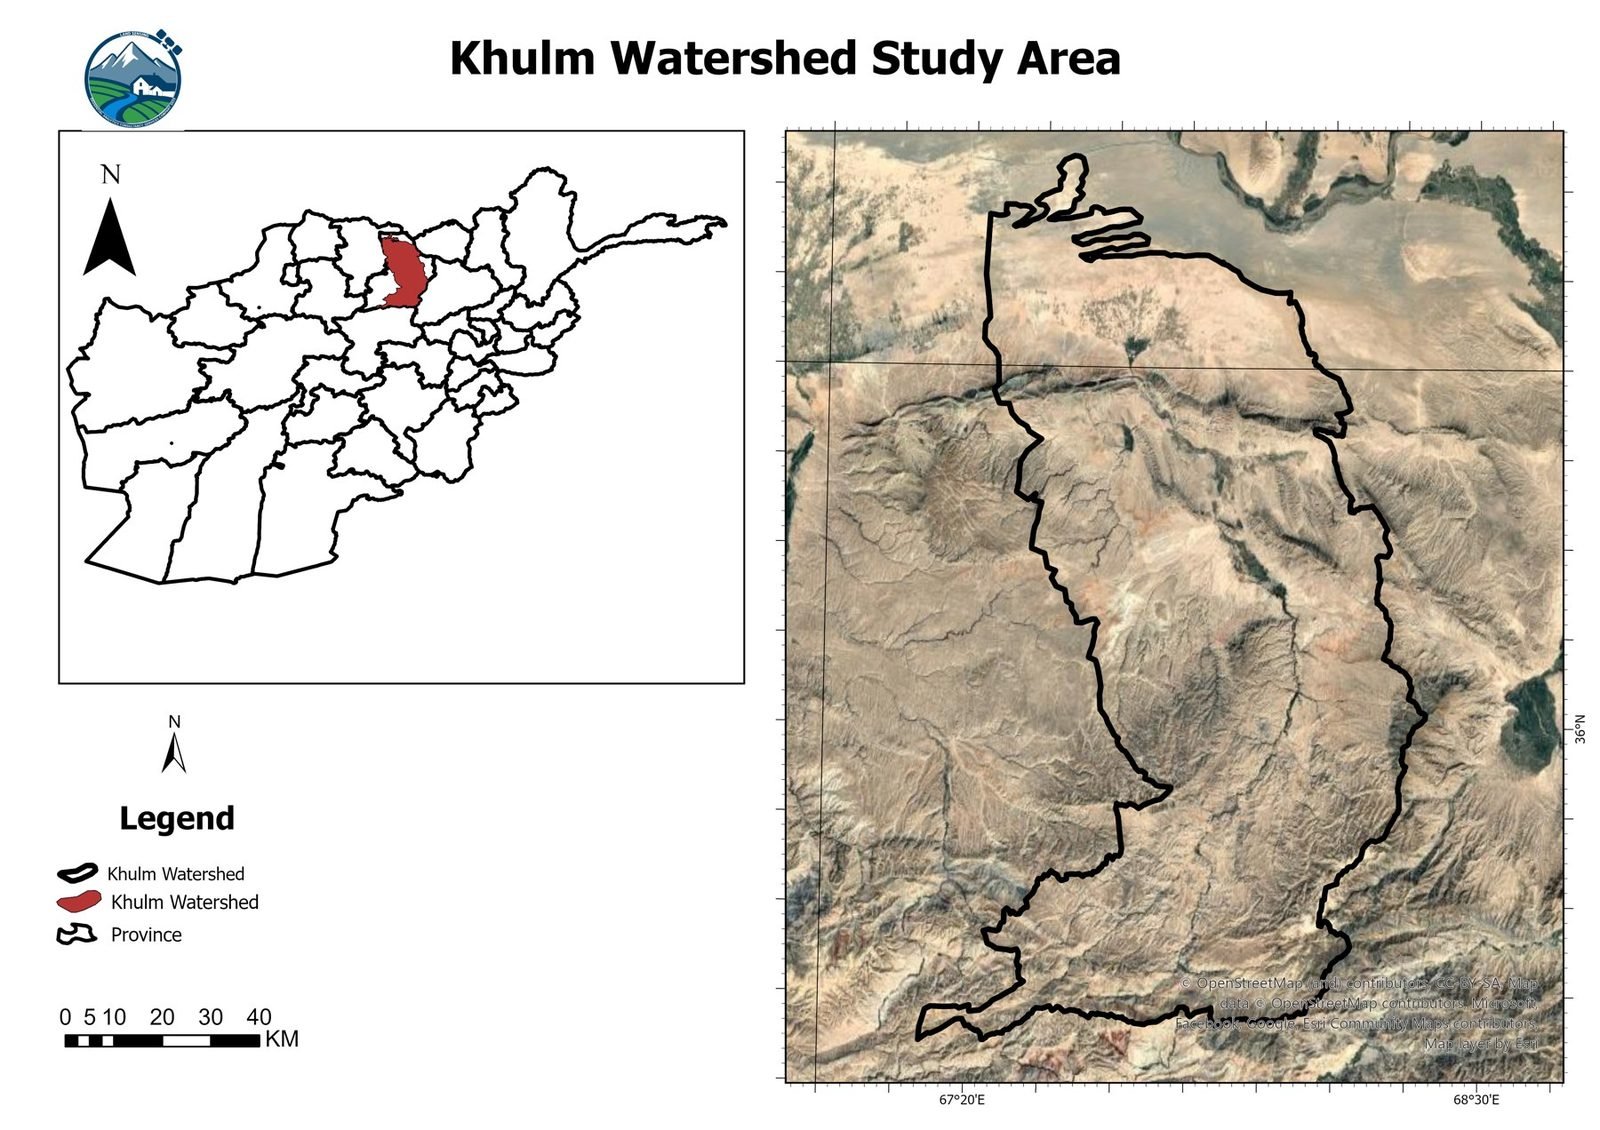
LSGA carried out a seasonal crop mapping and agricultural land analysis for the Khulm Watershed, Afghanistan, as part of a PhD research assignment associated with Kiel University, Germany. The work was undertaken by Ghayoor Shokory and Dawood Ehsani under the technical direction of LSGA. The study used satellite imagery, field observations, crop phenology, GIS and machine learning to identify and map agricultural crops across two main growing seasons.
Understanding the agricultural landscape
Agriculture in the Khulm Watershed follows different seasonal cultivation cycles. A single annual land cover map would not show the variety of crops grown through the year. LSGA therefore developed separate spring and summer crop classification models, to capture the differences between seasons and give a more detailed picture of agricultural land use.
Our approach
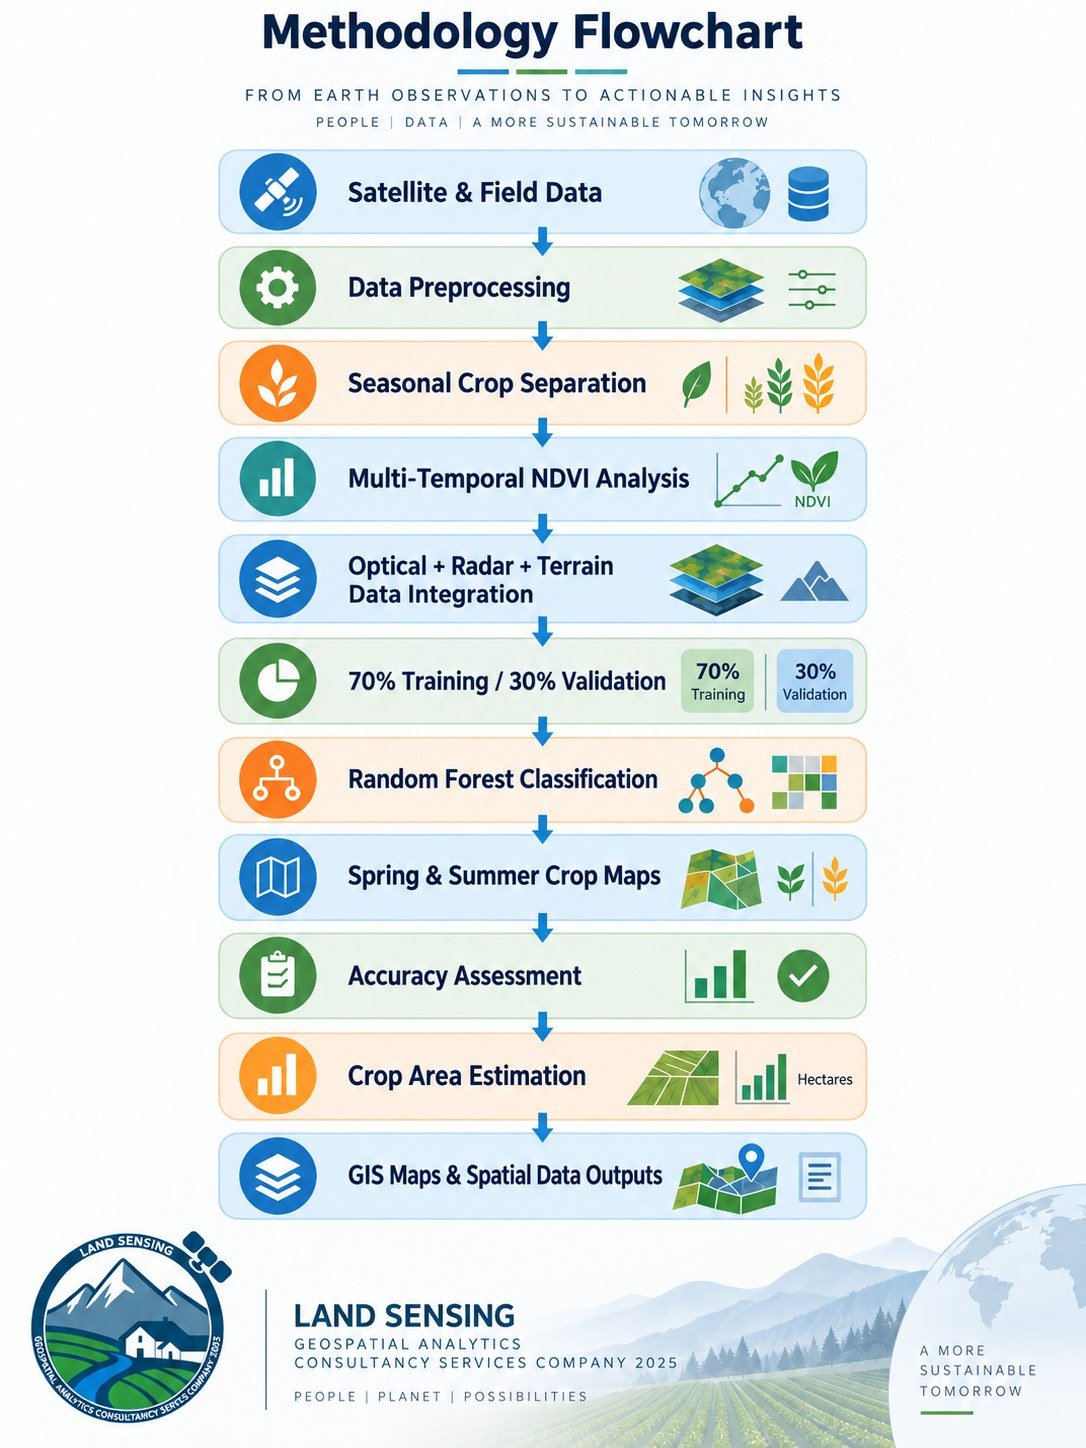
The project combined field observations with multi-source Earth observation data and machine learning classification. The workflow below shows the steps from data preparation to mapped outputs.
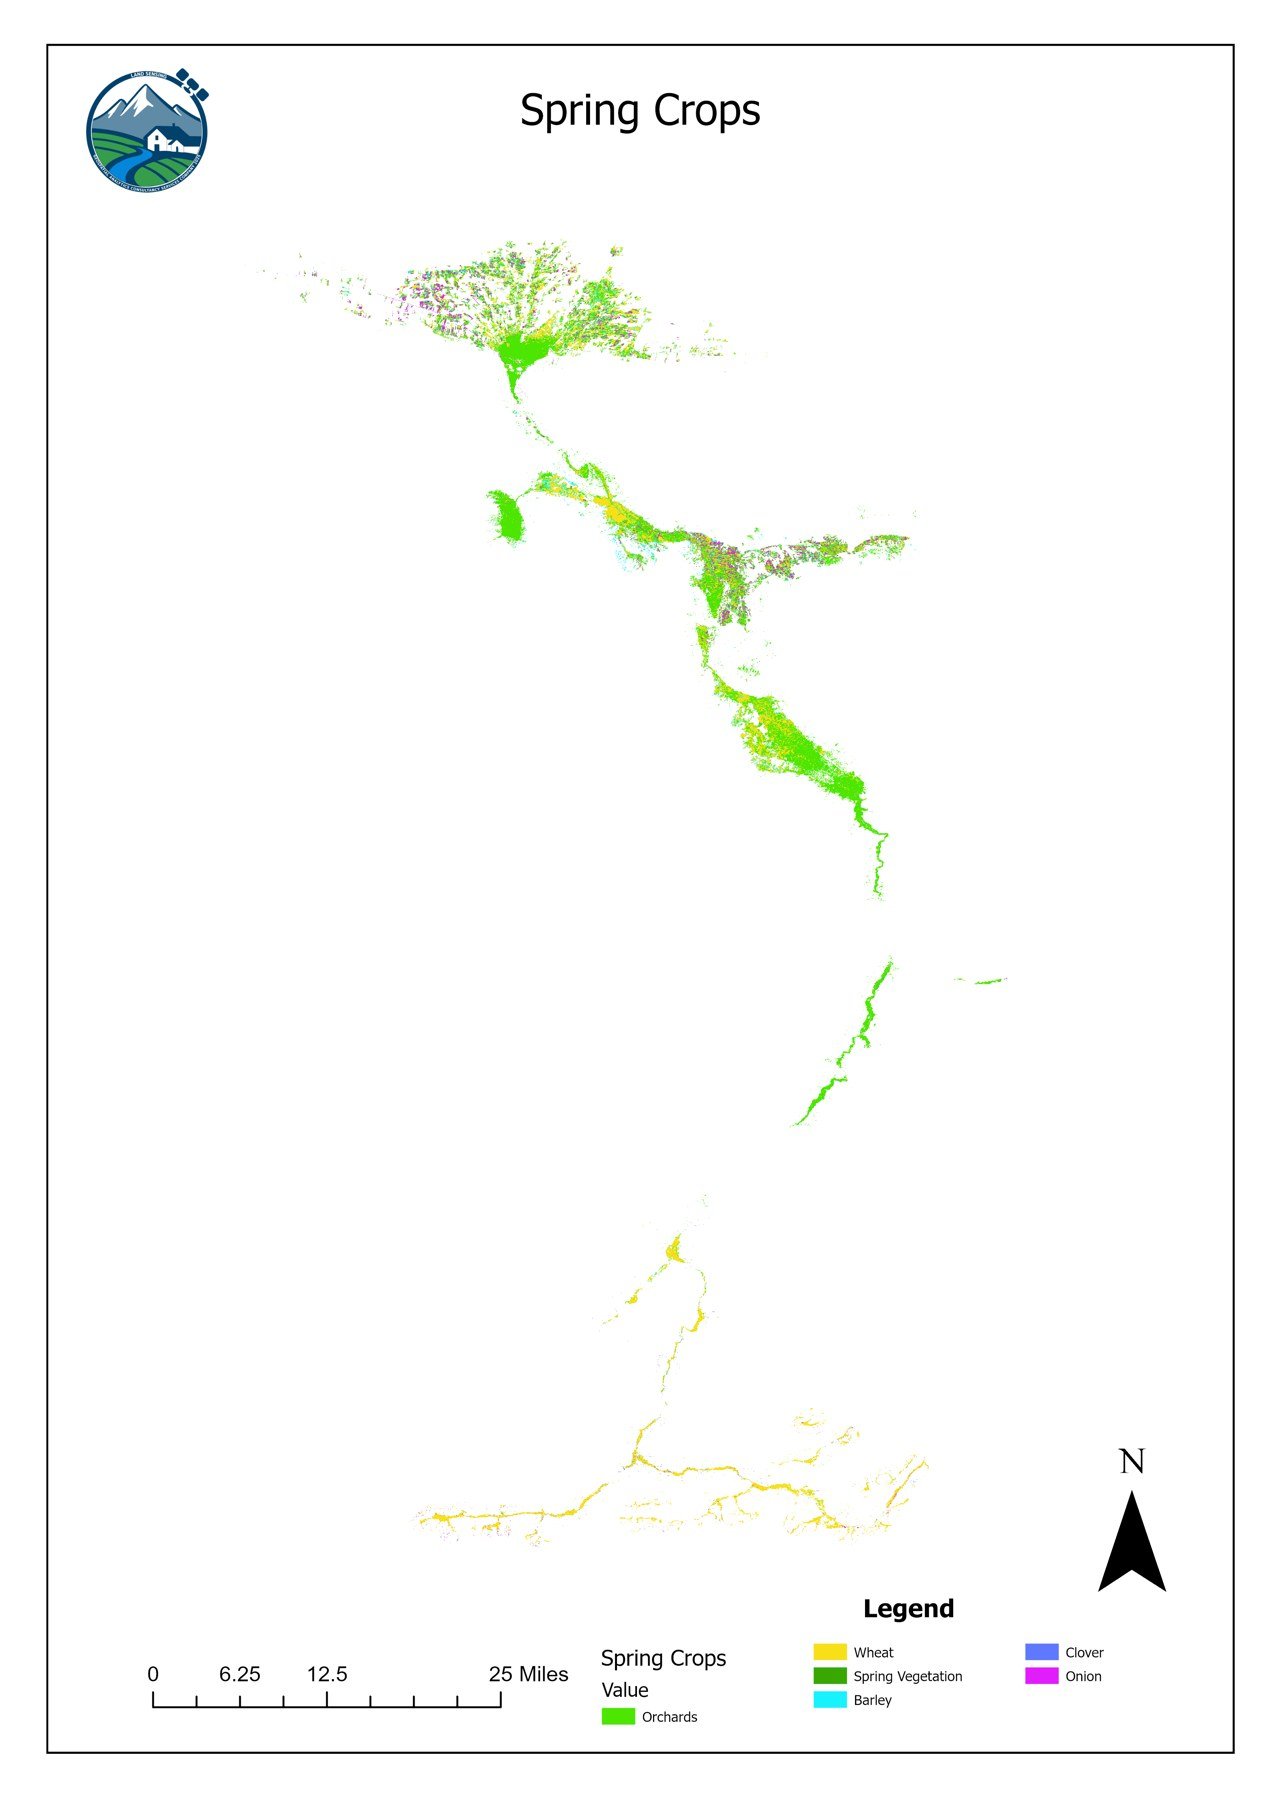
Spring crop mapping
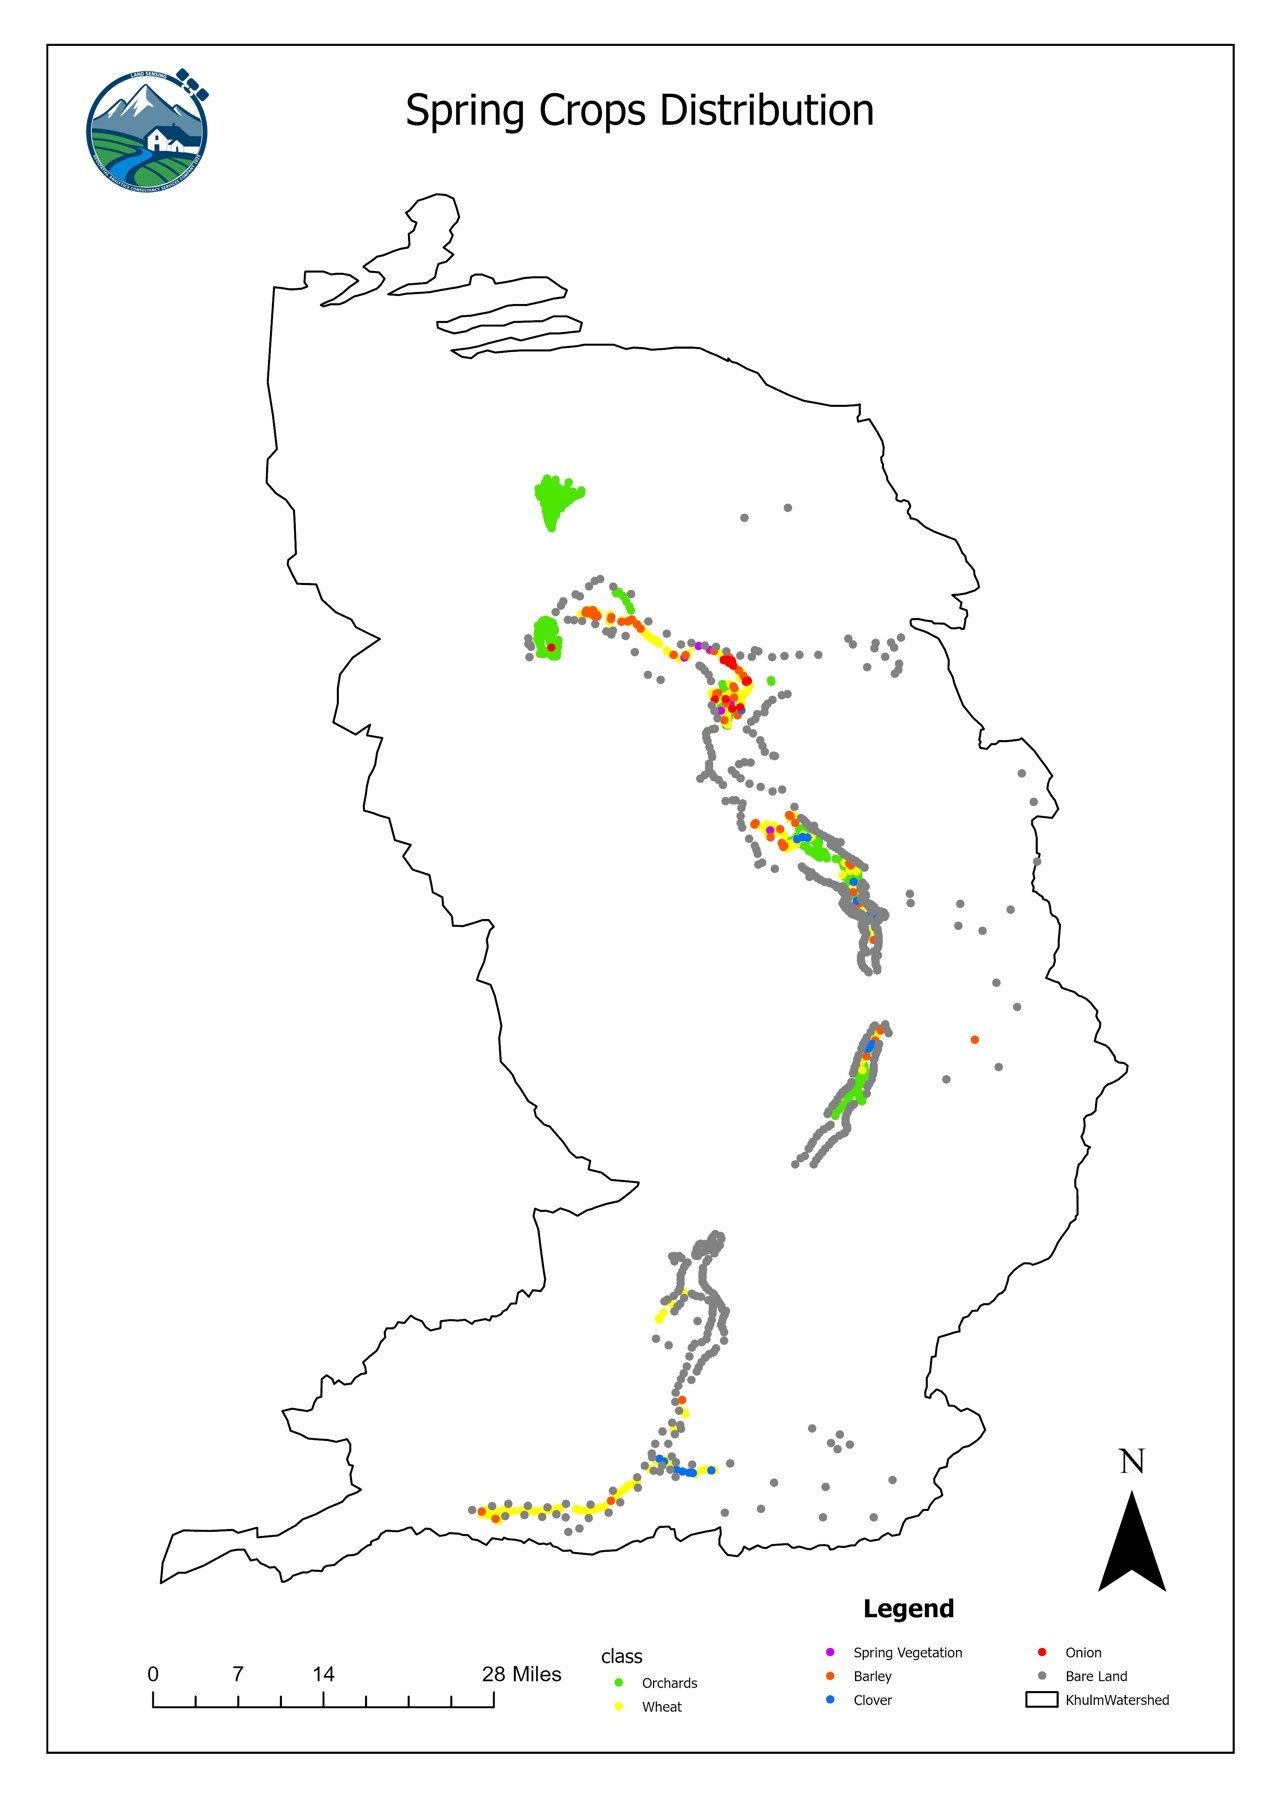
The spring classification identifies crops of the first growing season. Crop-specific growth periods were analysed with multi-temporal NDVI (Normalized Difference Vegetation Index) information.
| Spring crop or land class | Main growth period used |
|---|---|
| Wheat, barley | January–May |
| Clover | February–June |
| Onion | February–July |
| Orchards | March–September |
| Other crops and spring vegetables | March–June |
| Fallow land | Annual reference |
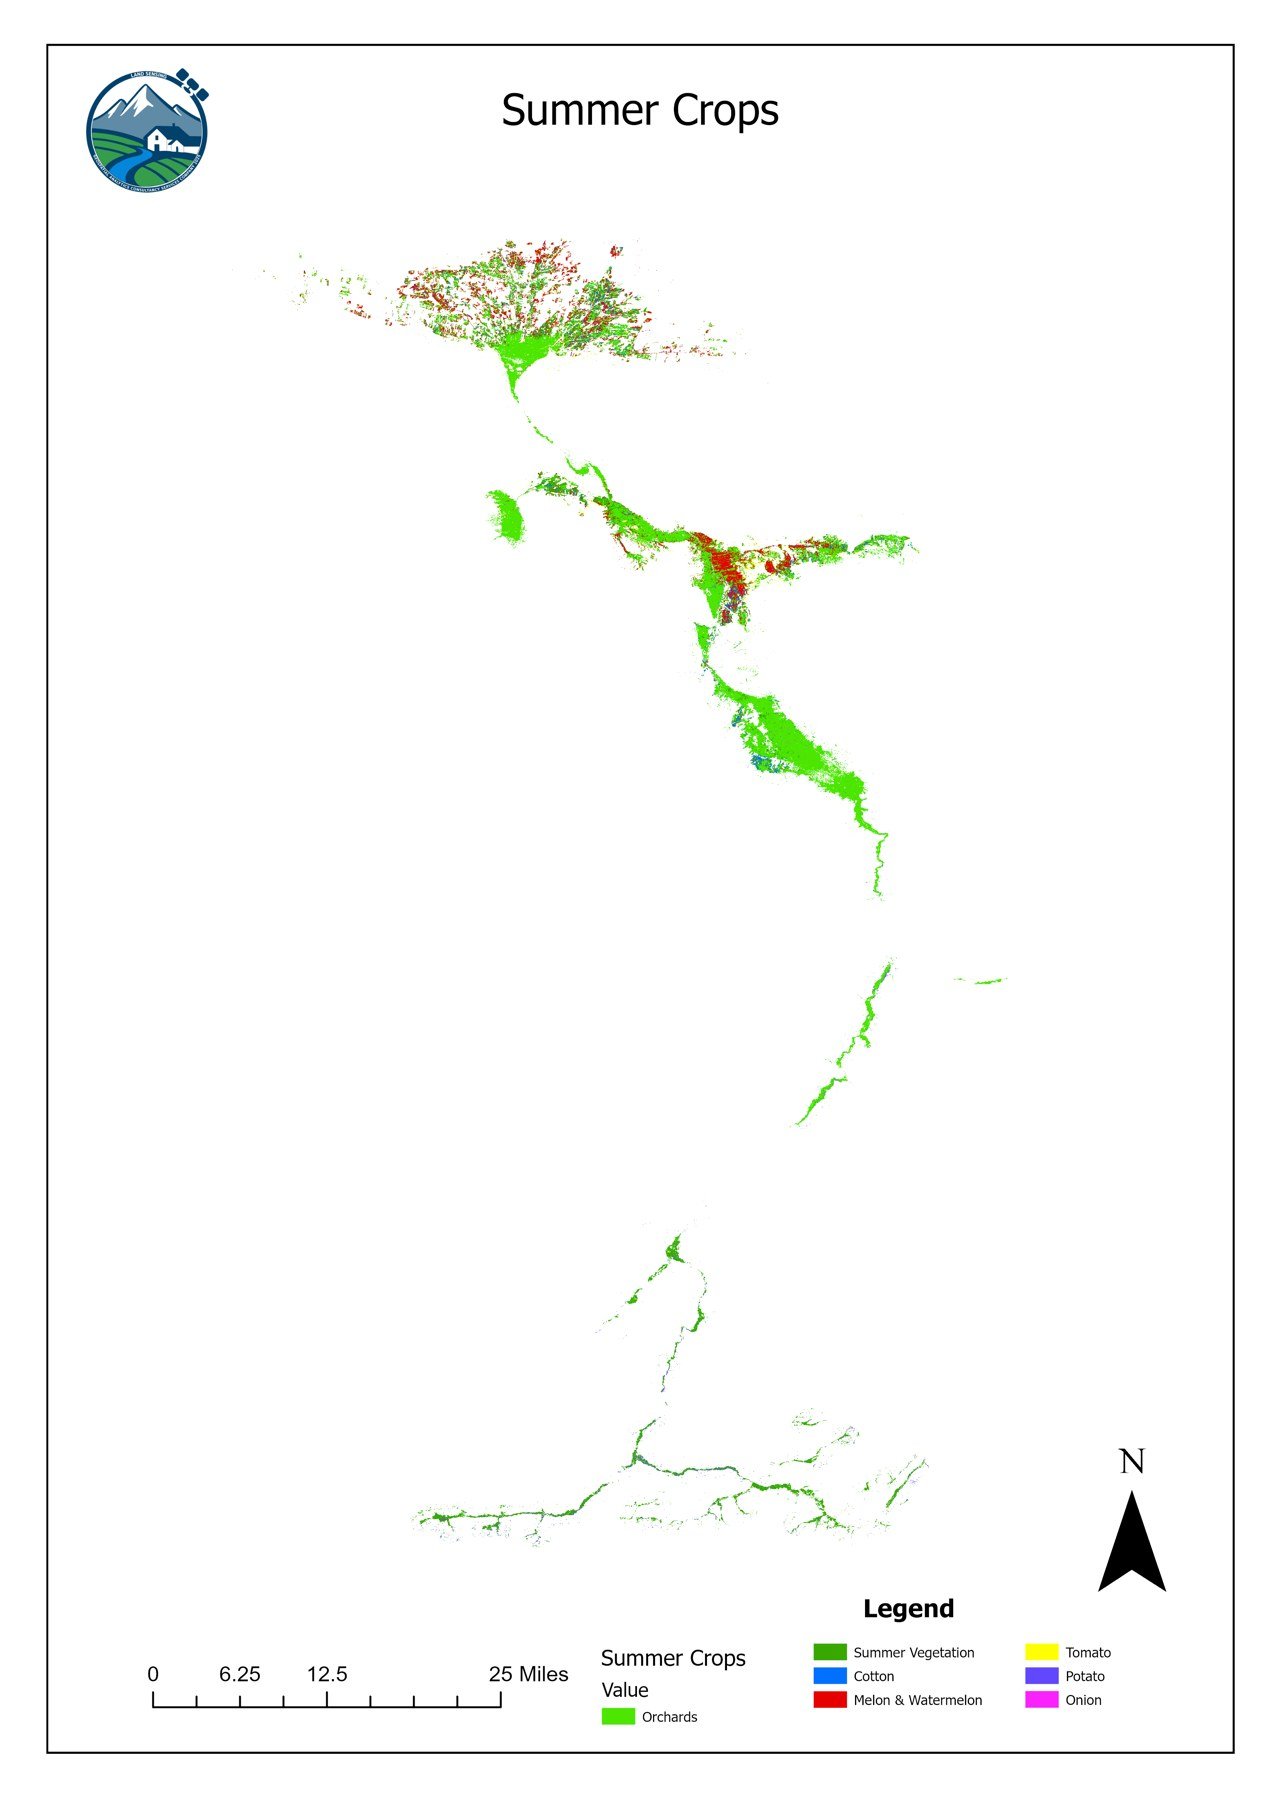
Summer crop mapping
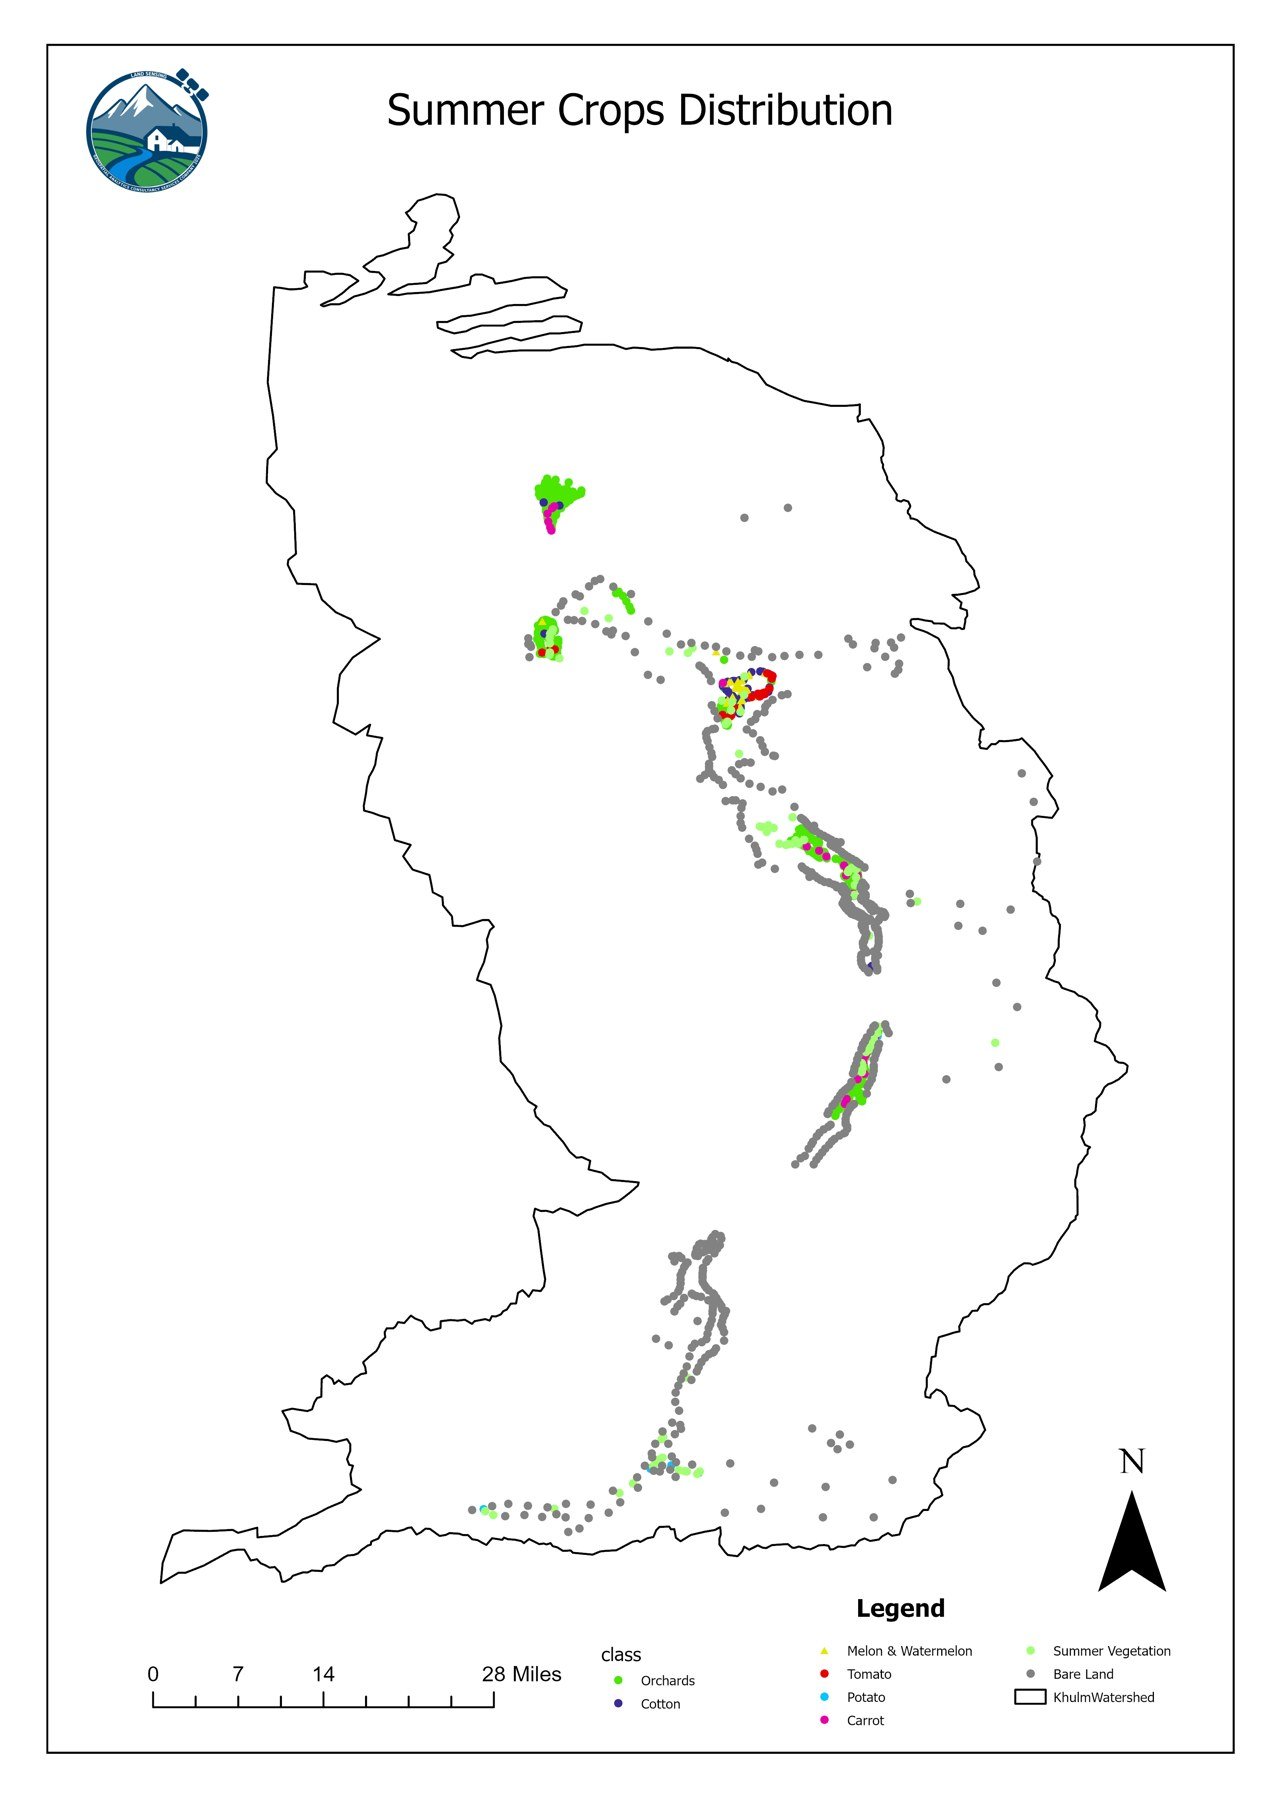
A separate classification was built for the summer season, because the main crops and vegetation cycles differ from spring. Most summer crop patterns were analysed between May and September.
| Summer crop or land class | Main growth period used |
|---|---|
| Cotton, melon and watermelon, tomato, potato, carrot, other summer crops | May–September |
| Orchards | March–September |
| Fallow land | Annual reference |
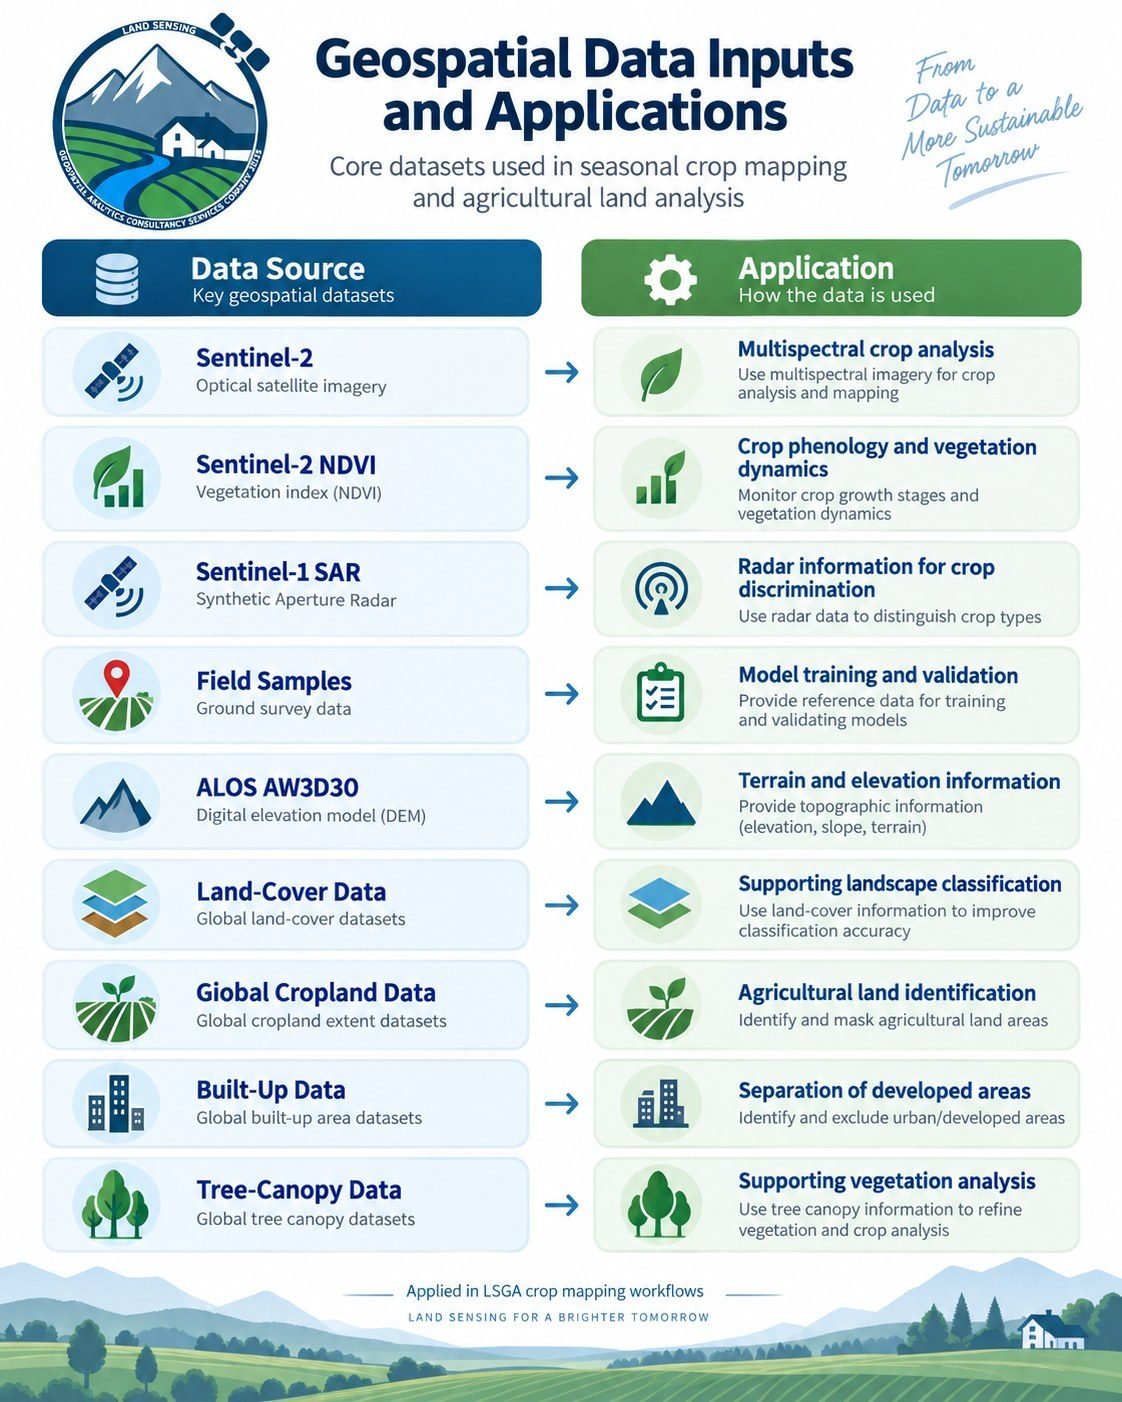
Multi-source geospatial analysis & Machine learning classification
The crop classification models combined several geospatial datasets at about 10 m resolution. LSGA developed supervised Random Forest models with 300 decision trees in Google Earth Engine. Field reference observations were split at random into 70% training data and 30% independent validation data, reaching 87% spring accuracy and 88% summer accuracy.
Crop area analysis & final maps
After classification, the mapped area of each crop was calculated in hectares. This allowed a quantitative analysis of crop distribution, cultivated area, dominant crops, fallow land, and the differences between spring and summer cultivation.
Technology: Google Earth Engine · Sentinel-1 SAR · Sentinel-2 · NDVI · Random Forest · Machine learning · GIS · Spatial analysis