Land Sensing Geospatial Analytics
Our Services
Verified geospatial information for agriculture, land and climate risk, and geospatial monitoring and verification of projects in any sector.
Overview
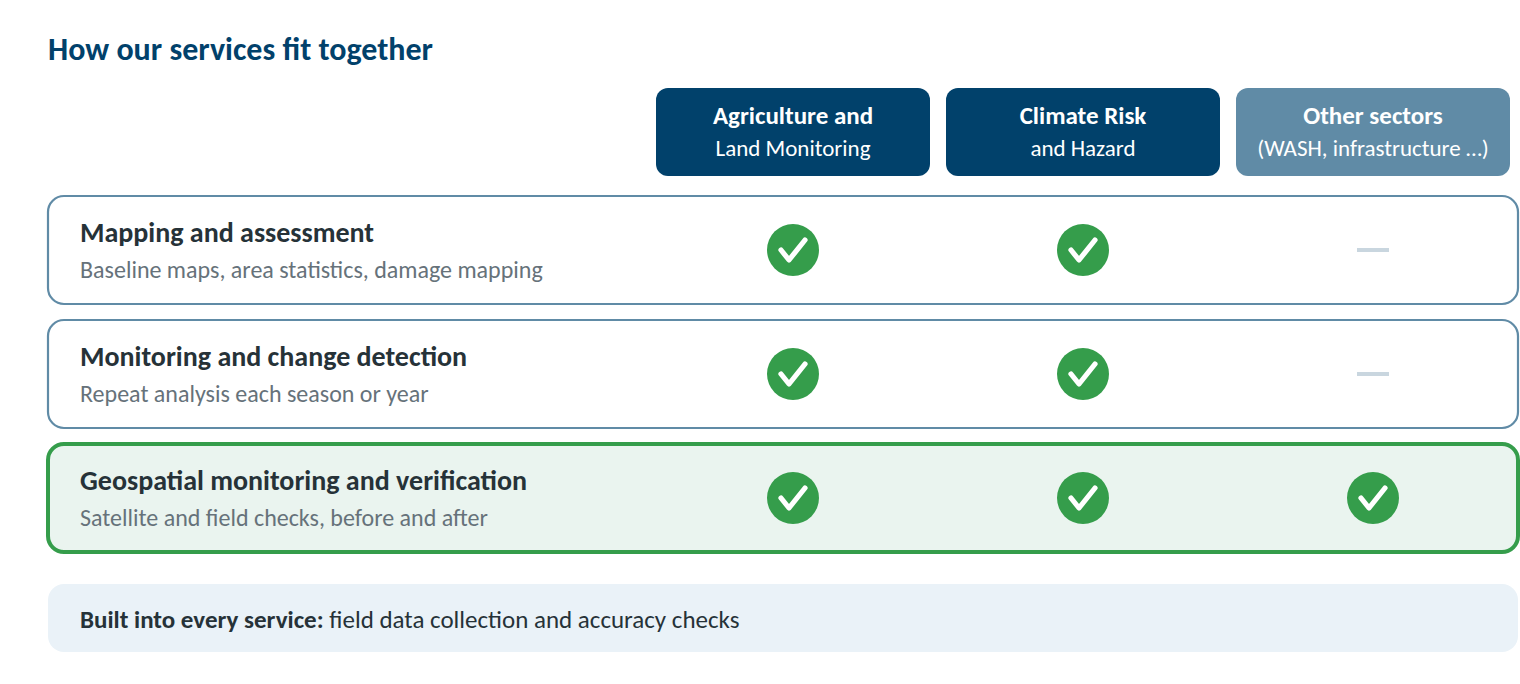
How our services fit together
We work in two sectors: agriculture and land, and climate risk and hazard. In both, we map and assess, and we monitor change over time. Our geospatial project monitoring and verification goes further: we can verify projects in any sector where results leave a visible footprint on the ground.
Sector 1
Agriculture and Land Monitoring
We map what is on the land, how it is used and how it is changing. Our maps and statistics help programmes target support, plan land and water use, and track results over time.
- Land use and land cover mapping. What is on the land, mapped by class and area, and how it has changed over time.
- Crop type mapping. Which crops are grown where, season by season.
- Irrigated and rainfed land. Where farming depends on irrigation and where on rainfall, and how often land is cropped or left fallow.
- Crop condition monitoring. How crops are developing through the season, and where they are under stress.
- Rangeland condition. Vegetation cover, grazing pressure and carrying capacity of pastures.
- Forest and vegetation cover. The extent of forests, shrubs and other vegetation, and how it changes.
- Land degradation and restoration. Where land is degrading, and whether restoration and afforestation sites are established and growing.
- Verified in the field. Our teams collect GPS reference points and field observations to train and check every map.
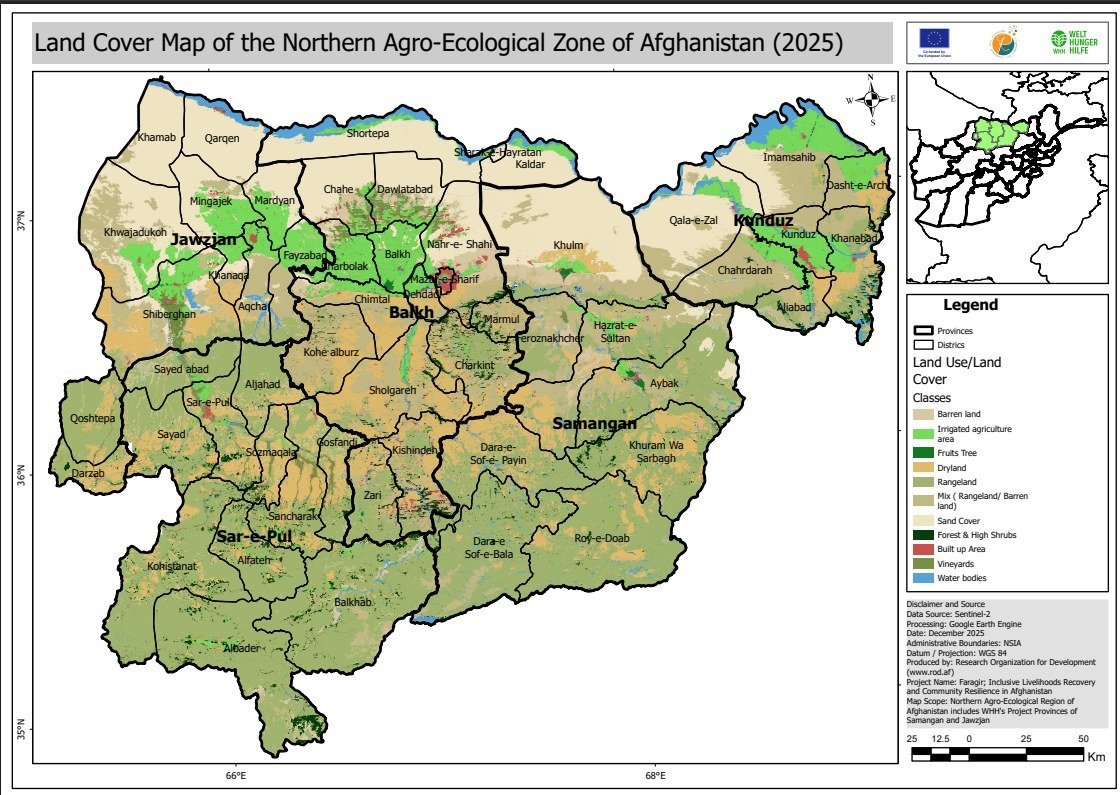 2025 Land Cover Map of northern Afghanistan (11 classes, 10 m resolution)
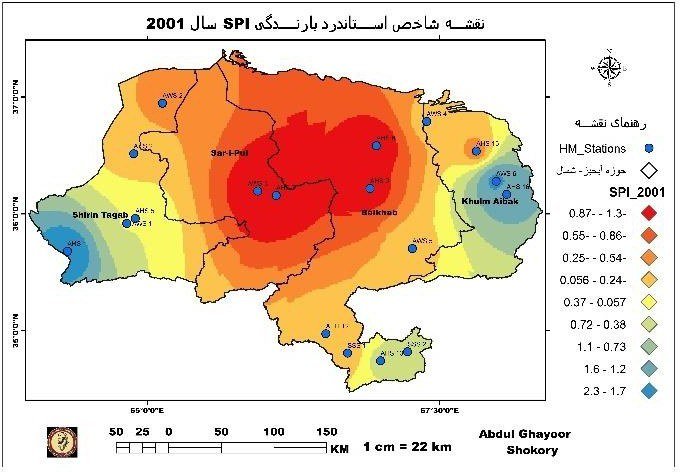 SPI Drought Map of the Northern River Basin (20-year assessment)
Sector 2
Climate Risk and Hazard
We assess where hazards occur, what is exposed, and what damage has been done. Our analysis helps agencies prepare, target their response and plan recovery.
- Drought monitoring and impact. Where drought is developing, how severe it is, and how it affects crops, rangeland and snow.
- Snow cover monitoring. Snow extent through the season, the water source for spring and summer irrigation.
- Flood and mudflow mapping. Flood extent, and the land, settlements and infrastructure affected after an event.
- Landslide mapping. Inventories of past landslides and maps of the slopes most likely to fail.
- Hazard, exposure and vulnerability mapping. Which people, land and assets lie in hazard zones.
- Post-disaster damage assessment. Rapid damage mapping after floods, landslides and drought, to guide response and recovery.
- Data for anticipatory action. Monitoring indicators and maps that help agencies act before a hazard reaches its peak.
- Verified in the field. Where access allows, we check affected areas on the ground and record damage with geotagged photos.
Any Sector with a Visible Footprint
Geospatial project monitoring and verification
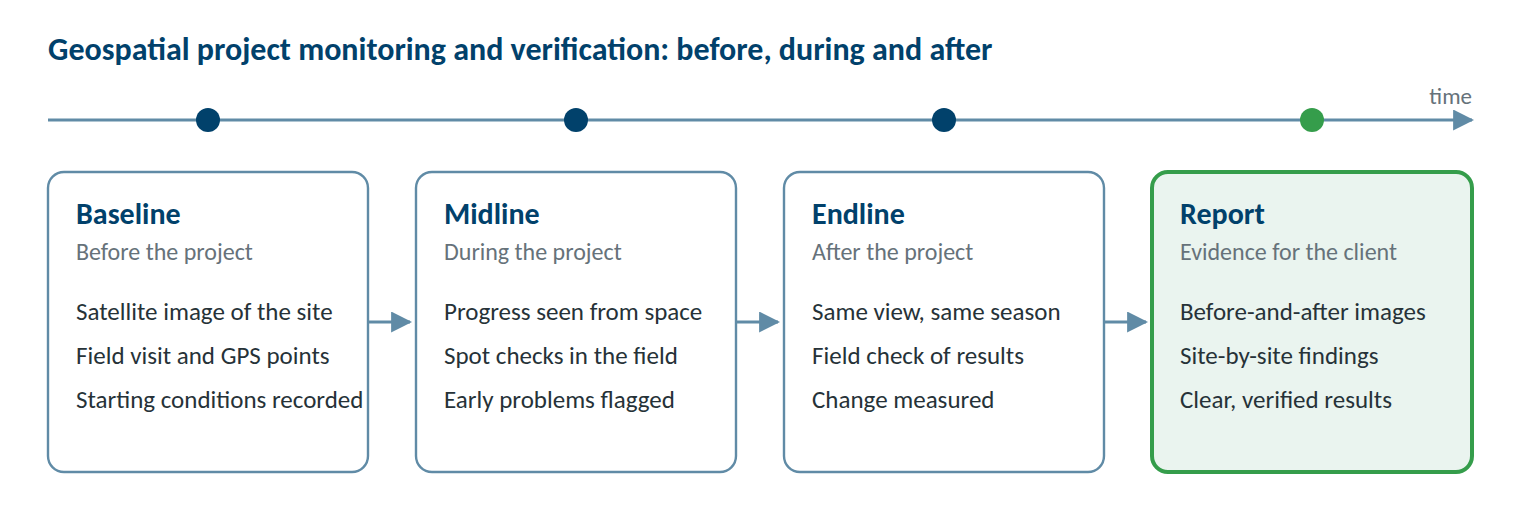
We monitor and verify projects with two tools: satellite remote sensing and field point collection. Satellite images show what exists and what has changed across all your project sites, before, during and after the work. Our field teams then visit a sample of sites to collect GPS points and geotagged photos, confirming on the ground what the images show.
The evidence comes from images and field records, not only from the reports of the implementing team.
What we verify
- Whether a structure exists, where it is, and whether it is complete
- Visible signs of use, such as water in a canal, irrigated fields or new tree cover
- Change on the land around a site: vegetation, cropland, water or settlements
- Conditions at the end of the project compared with the baseline
Sectors we cover
We can verify projects in any sector wherever results leave a visible footprint on the ground, for example:
Standard Deliverables
What you receive
Every assignment ends with results you can use straight away in your own work. Depending on the service, you receive:
Maps
Print-ready and web maps with clear legends
PDF, PNGGIS data
Raster and vector layers ready to open in your own GIS
GeoTIFF, Shapefile, GeoPackageArea statistics
Hectares or square kilometres by class, district or site
Excel, CSVAccuracy assessment
How reliable each map is, based on independent field data
Included in the reportField data
GPS reference points, geotagged photos and survey records
Excel, KML, photo archiveDashboards
An online view of results, for monitoring assignments where agreed
Web linkReports
Method, findings and limitations in plain language
PDF, Word